
Page 73 - Haryana Water Resources Atlas 2025
P. 73
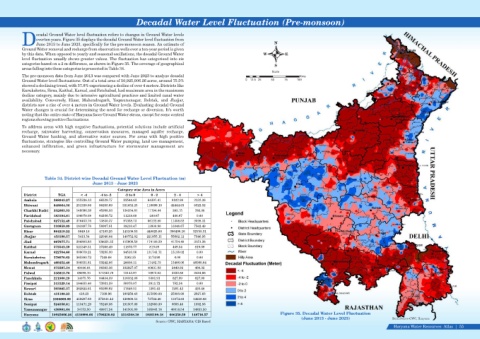
Decadal Water Level Fluctuation (Pre-monsoon)


                   ecadal Ground Water level fluctuation refers to changes in Ground Water levels
                   overten years. Figure 35 displays the decadal Ground Water level fluctuation from
            DJune 2013 to June 2023, specifically for the pre-monsoon season. An estimate of                                             N
            Ground Water removal and recharge from observation wells over a ten-year period is given
            by this data. When opposed to yearly and seasonal oscillations, the decadal Ground Water                                W          E
            level fluctuation usually shows greater values. The fluctuation has categorized into six
            categories based on a 2 m difference, as shown in Figure 35. The coverage of geographical
                                                                                                                                         S
            areas falling into these categories is presented in Table 34.
                                                                                                                                        Scale
            The pre-monsoon data from June 2013 was compared with June 2023 to analyze decadal                                                        Kms
            Ground Water level fluctuations. Out of a total area of 10,925,006.26 acres, around 75.5%                      0  12.5 25   50    75    100
            showed a declining trend, with 37.8% experiencing a decline of over 4 meters. Districts like
            Kurukshetra, Sirsa, Kaithal, Karnal, and Fatehabad, had maximum area in the maximum
            decline category, mainly due to intensive agricultural practices and limited canal water
            availability.  Conversely,  Hisar,  Mahendragarh,  Yaqmunanagar,  Rohtak,  and  Jhajjar,
            districts saw a rise of over 4 meters in Ground Water levels. Evaluating decadal Ground
            Water changes is crucial for determining the need for recharge or diversion. It's worth
            noting that the entire state of Haryana faces Ground Water stress, except for some central
            regions showing positive fluctuations.

            To address areas with high negative fluctuations, potential solutions include artificial
            recharge,  rainwater  harvesting,  conservation  measures,  managed  aquifer  recharge,
            Ground  Water  banking,  and  alternative  water  sources.  For  areas  with  high  positive
            fluctuations, strategies like controlling Ground Water pumping, land use management,
            enhanced  infiltration,  and  green  infrastructure  for  stormwater  management  are
            necessary.


                       Table 34. District-wise Decadal Ground Water Level Fluctuation (m)

                                               June 2013 - June 2023

                                                           Category wise Area in Acres

             District         TGA        < -4      -4 to -2    -2 to 0      0 - 2      2 - 4       > 4

             Ambala         388943.27  155236.13  66529.77    92544.62    64397.41    8102.98    2132.36

             Bhiwani        848064.36  251339.98  98205.69    331652.25   116099.10   42444.83   8322.52


             Charkhi Dadri  332603.33    149396.29    45998.33  124234.81  11794.44    393.15     786.30


             Faridabad      183104.81    106978.08    64106.72  11218.68   400.67      400.67      0.00


             Fatehabad      627152.49    376453.76     73830.37  97358.73  66122.80   11358.52   2028.31


             Gurugram       310858.09    181897.76     58907.81  38210.47  13930.90   10348.67   7562.49


             Hisar          984219.22   5849.16   47183.25    143109.53   448825.80  306496.16   32755.31

             Jhajjar        453190.57   5413.54   22040.84    140752.02   221955.11   55682.12   7346.95

             Jind           667677.71  206802.83  126051.25   115809.59   174108.29   41754.48   3151.28

             Kaithal        572542.29  521349.31  37268.49    11876.77     819.09      409.54     819.09

             Karnal         622704.60  308079.21  73235.30    94510.36    131741.71   15138.02     0.00

             Kurukshetra    378070.65  365383.72   7249.68     3262.35     2174.90      0.00       0.00


             Mahendragarh   469252.40    308331.81    53242.86  28608.11  17482.73    15496.06   46090.84


             Mewat          372387.24     49406.64    96363.36  182927.07  40831.93   2449.92     408.32


             Palwal         335815.70     68698.76    171342.79  73143.97  16972.63   3232.88    2424.66

             Panchkula      221900.29     14075.76    84454.59  116332.06  5381.91     827.99     827.99


             Panipat        313329.14  184633.40  73931.59    50070.07     3911.72     782.34      0.00

             Rewari         393885.37  282822.61  90399.92    17649.51     1291.43    1291.43     430.48

             Rohtak         431198.23   418.23     7109.96    180258.43   215390.00   25093.98   2927.63

             Sirsa         1056868.09  450207.88  373611.43   129969.51   73744.46    15074.83   14259.98

             Sonipat        524356.81  113471.29  75249.38    191507.69   132980.39   9555.48    1592.58
             Yamunanagar    436881.64    24752.50    49917.54  141501.80  165841.76   40016.54   14851.50


             Haryana       10925006.26 4130998.66  1796230.92  2316508.38  19261  99.18  606350.59  148718.57                               Figure 35. Decadal Water Level Fluctuation
                                                                                                                                                      (June 2013 - June 2023)                       Data Source-GWC, Haryana
                                                                              Source: GWC, HARYANA/ GIS Based
                                                                                                                                                                                                     Haryana Water Resources  Atlas     55|