
Page 75 - Haryana Water Resources Atlas 2025
P. 75
Long-term Water Level Fluctuation (Pre-monsoon)
N
W E
ong-term Ground Water level fluctuations refer to the changes in aquifer water
storage over several decades or centuries. These fluctuations have significant impacts S
Lon Ground Water users, communities, and ecosystems. They can be influenced by Scale
various factors, such as agricultural use, land use changes, and Ground Water extraction. Kms
Long-term drops in Ground Water levels can be caused by extended droughts and higher 0 12.5 25 50 75 100
pumping rates; long-term gains can be caused by greater precipitation and lower pumping
rates.
Declining Ground Water levels can reduce water availability for crops, wildlife, and other
uses, cause land subsidence, and degrade aquifer systems. Conversely, rising Ground Water
levels can lead to waterlogging, soil salinization, and other negative impacts. Effective
Ground Water management involves measures like artificial recharge, land use
management, crop diversification, efficient irrigation, and regulation of withdrawals. Long-
term changes necessitate a comprehensive strategy that takes climate change and other
variables impacting Ground Water resources into account.
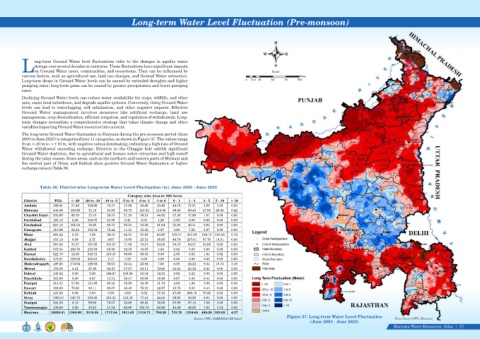
The long-term Ground Water fluctuation in Haryana during the pre-monsoon period (June
2003 to June 2023) is categorized into 11 categories, as shown in Figure 37. The values range
from <-20 m to >+10 m, with negative values dominating, indicating a high rate of Ground
Water withdrawal exceeding recharge. Districts in the Ghaggar belt exhibit significant
Ground Water depletion, due to agricultural and human water extraction and high runoff
during the rainy season. Some areas, such as the northern and eastern parts of Bhiwani and
the central part of Hisar, and Rohtak show positive Ground Water fluctuation or higher
recharge rates in Table 36.
Table 36. District-wise Long-term Water Level Fluctuation (m), June 2003 - June 2023
Category wise Area in '000 Acres
District TGA < -20 -20 to -10 -10 to -5 -5 to -3 -3 to -1 -1 to 0 0 - 1 1 - 3 3 - 5 5 - 10 > 10
Ambala 388.94 17.49 126.66 70.37 37.96 46.49 23.46 44.78 17.91 2.56 1.28 0.00
Bhiwani 848.06 158.96 71.16 91.55 65.75 116.52 110.69 89.88 69.49 47.85 25.80 0.42
Charkhi Dadri 332.60 69.19 72.73 28.31 21.23 39.31 44.82 37.35 17.69 1.57 0.39 0.00
Faridabad 183.10 2.40 103.37 61.70 8.41 6.01 1.20 0.00 0.00 0.00 0.00 0.00
Fatehabad 627.15 331.02 75.05 65.72 22.31 33.26 31.64 21.91 43.41 2.84 0.00 0.00
Gurugram 310.86 52.54 133.34 72.44 11.14 15.52 5.97 3.98 7.56 5.97 2.39 0.00
Hisar 984.22 0.78 1.56 26.13 68.24 81.50 63.95 102.17 327.94 189.12 122.05 0.78
Jhajjar 453.19 0.00 2.71 9.67 10.05 25.13 18.95 46.79 237.81 87.78 14.31 0.00
Jind 667.68 21.27 157.56 131.57 71.69 70.51 52.00 54.75 86.27 22.06 0.00 0.00
Kaithal 572.54 238.76 219.93 68.39 32.35 10.65 1.64 0.82 0.00 0.00 0.00 0.00
Karnal 622.70 12.68 318.31 119.47 89.60 68.33 9.00 2.05 0.82 1.64 0.82 0.00
Kurukshetra 378.07 139.92 235.61 2.17 0.36 0.00 0.00 0.00 0.00 0.00 0.00 0.00
Mahendragarh 469.25 173.64 129.93 58.01 23.44 23.84 7.55 6.36 24.24 8.34 10.73 3.18
Mewat 372.39 5.31 27.36 62.47 57.57 64.11 72.68 55.53 25.32 2.04 0.00 0.00
Palwal 335.82 0.00 9.29 144.67 103.86 53.34 12.53 8.89 3.23 0.00 0.00 0.00
Panchkula 221.90 0.00 4.97 71.21 58.37 65.00 14.49 4.97 2.48 0.41 0.00 0.00
Panipat 313.33 17.60 111.88 93.10 35.99 36.38 11.74 4.69 1.96 0.00 0.00 0.00
Rewari 393.89 70.60 58.11 99.87 46.49 76.19 24.97 10.76 6.03 0.43 0.43 0.00
Rohtak 431.20 0.00 0.00 0.00 0.00 5.02 17.15 47.68 288.16 70.26 2.93 0.00
Sirsa 1056.87 247.72 156.86 313.31 145.45 77.41 44.82 39.93 30.56 0.81 0.00 0.00
Sonipat 524.36 5.18 69.68 70.07 32.65 80.43 72.06 87.99 97.15 7.56 1.59 0.00
Yamunanagar 436.88 0.00 30.53 57.34 68.89 123.76 58.99 42.49 46.62 7.01 1.24 0.00
Haryana 10925.01 1565.06 2116.59 1717.54 1011.83 1118.7 1 700.28 713.76 1334.64 458.28 183.95 4.3 7
Figure 37. Long-term Water Level Fluctuation
Source: GWC, HARYANA/ GIS Based Data Source-GWC, Haryana
(June 2003 - June 2023)
Haryana Water Resources Atlas 57|