
Page 76 - Haryana Water Resources Atlas 2025
P. 76
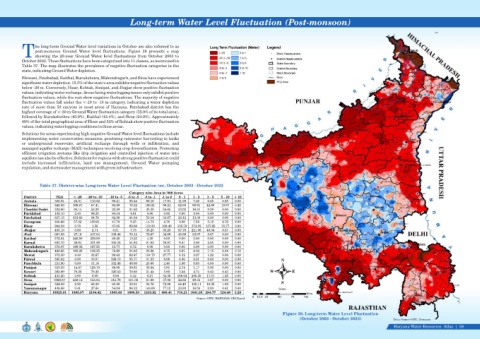
Long-term Water Level Fluctuation (Post-monsoon)


                  he long-term Ground Water level variations in October are also referred to as
                  post-monsoon  Ground  Water  level  fluctuations.  Figure  38  presents  a  map
            Tshowing  the  20-year  Ground  Water  level  fluctuations  from  October  2003  to
            October 2023. These fluctuations have been categorized into 11 classes, as mentioned in
            Table 37. The map illustrates the prevalence of negative fluctuation categories in the
            state, indicating Ground Water depletion.

            Bhiwani, Fatehabad, Kaithal, Kurukshetra, Mahendragarh, and Sirsa have experienced
            significant water depletion. 15.5% of the state's area exhibits negative fluctuation values
            below -20 m. Conversely, Hisar, Rohtak, Sonipat, and Jhajjar show positive fluctuation
            values, indicating water recharge. Areas facing waterlogging issues only exhibit positive
            fluctuation values, while the rest show negative fluctuations. The majority of negative
            fluctuation values fall under the <-20 to -10 m category, indicating a water depletion
            rate of more than 50 cm/year in most areas of Haryana. Fatehabad district has the
            highest coverage of <-20 m Ground Water fluctuation category (52.9% of its total area),
            followed by Kurukshethra (43.9%), Kaithal (43.4%), and Sirsa (24.9%). Approximately
            49% of the total geographical area of Hisar and 52% of Rohtak show positive fluctuation
            values, indicating waterlogging conditions in these areas.
            Solutions for areas experiencing high negative Ground Water level fluctuations include
            implementing water conservation measures, practising rainwater harvesting in tanks
            or  underground  reservoirs,  artificial  recharge  through  wells  or  infiltration,  and
            managed aquifer recharge (MAR) techniques involving crop diversification. Promoting
            efficient irrigation systems like drip irrigation and controlled injection of water into
            aquifers can also be effective. Solutions for regions with strong positive fluctuation could
            include  increased  infiltration,  land  use  management,  Ground  Water  pumping
            regulation, and stormwater management with green infrastructure.


                      Table 37. District-wise Long-term Water Level Fluctuation (m), October 2003 - October 2023


                                                                 Category wise Area in '000 Acres


             District        TGA     < -20  -20 to -10  -10 to -5  -5 to -3  -3 to -1  -1 to 0  0 - 1  1 - 3  3 - 5  5 - 10  > 10


             Ambala           388.94     26.01    113.02     90.41  55.44  66.10  17.91     11.09     7.25     0.85  0.85  0.00


             Bhiwani        848.06     166.87     67.41     84.89  75.32  160.21  98.21    62.00     69.91     42.86  19.97  0.42


             Charkhi Dadri  332.60     95.14    52.29     23.59  21.62   35.38    54.65    33.02     16.51     0.39  0.00  0.00


             Faridabad      183.10     2.40    89.35      84.14   4.81    0.80    0.80    0.80     0.00     0.00  0.00  0.00
             Fatehabad      627.15     331.83     84.78     62.88  24.34  53.14    33.67    23.12    13.39    0.00  0.00  0.00


             Gurugram       310.86     57.32     159.61     47.76  9.15  14.73    4.78     3.98     7.56     3.18  2.79  0.00


             Hisar          984.22     0.78     1.56      67.85  66.68   112.30  108.40     135.70    274.52  137.65  78.77  0.00


             Jhajjar        453.19     0.00     2.71       8.51   7.73   33.25    33.25     87.78    221.96     48.34  9.67  0.00


             Jind           667.68    27.18   217.04    139.44   70.12   72.87    32.69  45.69  53.97   8.67   0.00   0.00

             Kaithal        572.54   248.59   239.99     60.20   19.25    4.50    0.00    0.00   0.00   0.00   0.00   0.00


             Karnal         622.70     28.64  321.99      100.24  54.82  81.83    20.87     9.41     2.86     2.05  0.00  0.00


             Kurukshetra      378.07     166.02  197.55    13.77  0.72    0.00    0.00    0.00     0.00     0.00  0.00  0.00


             Mahendragarh   469.25     185.95     126.35     76.69  24.63  20.26    6.75    3.97     6.36     7.15  8.34  2.78
             Mewat          372.39     4.49     32.67     99.63  62.47   134.75    27.77    6.12     3.27     1.22  0.00  0.00


             Palwal         335.82     0.00     10.51    228.73  55.77   31.52    8.08    0.40     0.81     0.00  0.00  0.00                 N


             Panchkula      221.90     0.00    11.18      132.48  49.68  23.60    2.48     1.66     0.83     0.00  0.00  0.00


             Panipat        313.33     14.47    128.70     88.80  39.51  33.64    3.91     2.74     1.17     0.39  0.00  0.00


             Rewari         393.89    78.35   78.35     120.53   70.60   31.42    5.60    3.44   4.74   0.43   0.43   0.00             W          E


             Rohtak         431.20     0.00     0.00      0.00    0.42    6.27    34.30     166.04    205.35    17.57  1.25  0.00


             Sirsa          1056.87     259.12  155.64    315.76  151.56  81.89    37.08     22.82     29.33     3.67  0.00  0.00


             Sonipat        524.36     2.39     66.09     65.30  39.81   94.76    72.06     66.49    105.11    10.35  1.99  0.00              S


             Yamunanagar    436.88     0.41    27.64     54.04   96.12   140.68   77.15     23.93    16.50    0.00    0.41  0.00              Scale


             Haryana       10925.01    1695.97    2184.42  1965.63  1000.59  1233.92  680.41    710.21 1041.39 284.77  124.48  3.20


                                                                                                                                                         Kms
                                                                                                                              0  12.5 25   50    75     100
                                                                                                   Source: GWC, HARYANA/ GIS Based


                                                                                                                                               Figure 38. Long-term Water Level Fluctuation
                                                                                                                                                      (October 2003 - October 2023)                  Data Source-GWC, Haryana
                                                                                                                                                                                                     Haryana Water Resources  Atlas     58|