
Page 74 - Haryana Water Resources Atlas 2025
P. 74
Decadal Water Level Fluctuation (Post-monsoon)
N
W E
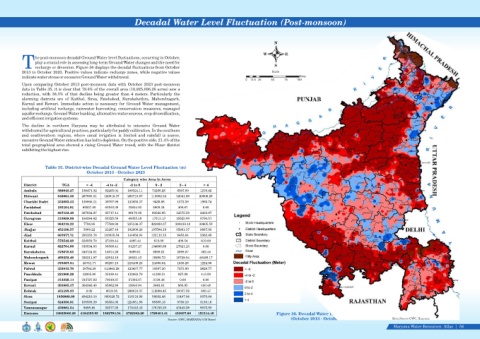
he post-monsoon decadal Ground Water level fluctuations, occurring in October,
play a crucial role in assessing long-term Ground Water changes and the need for
S
Trecharge or diversion. Figure 36 displays the decadal fluctuations from October
2013 to October 2023. Positive values indicate recharge zones, while negative values Scale
indicate water stress or excessive Ground Water withdrawal. Kms
0 12.5 25 50 75 100
Upon comparing October 2013 post-monsoon data with October 2023 post-monsoon
data in Table 35, it is clear that 78.6% of the overall area (10,925,006.26 acres) saw a
reduction, with 38.3% of that decline being greater than 4 meters. Particularly the
alarming districts are of Kaithal, Sirsa, Fatehabad, Kurukshethra, Mahendragarh,
Karnal and Rewari. Immediate action is necessary for Ground Water management,
including artificial recharge, rainwater harvesting, conservation measures, managed
aquifer recharge, Ground Water banking, alternative water sources, crop diversification,
and efficient irrigation systems.
The decline in northern Haryana may be attributed to intensive Ground Water
withdrawal for agricultural practices, particularly for paddy cultivation. In the southern
and southwestern regions, where canal irrigation is limited and rainfall is scarce,
excessive Ground Water extraction has led to depletion. On the positive side, 21.4% of the
total geographical area showed a rising Ground Water trend, with the Hisar district
exhibiting the highest rise.
Table 35. District-wise Decadal Ground Water Level Fluctuation (m)
October 2013 - October 2023
Category wise Area in Acres
District TGA < -4 -4 to -2 -2 to 0 0 - 2 2 - 4 > 4
Ambala 388943.27 136471.32 62265.04 108324.11 74206.28 6397.09 1279.42
Bhiwani 848064.36 267985.01 126918.37 286710.67 113602.34 32041.69 20806.29
Charkhi Dadri 332603.33 156866.11 39707.96 123055.37 9435.56 1572.59 1965.74
Faridabad 183104.81 82537.40 62103.38 32454.03 5609.34 400.67 0.00
Fatehabad 627152.49 367934.87 65717.14 98170.05 80320.95 12575.50 2433.97
Gurugram 310858.09 164384.62 55325.58 49355.19 17513.13 15523.00 8756.57
Hisar 984219.22 7798.88 77598.90 235136.37 423869.37 209010.10 30805.59
Jhajjar 453190.57 5800.22 21267.48 182900.29 197594.18 35961.37 9667.03
Jind 667677.71 255253.78 133535.54 144958.94 122112.15 9453.84 2363.46
Kaithal 572542.29 538959.70 27439.44 4095.44 819.09 409.54 819.09
Karnal 622704.60 310534.03 58506.41 91237.27 134605.66 27821.23 0.00
Kurukshetra 378070.65 340734.81 16674.26 8699.61 8699.61 2899.87 362.48
Mahendragarh 469252.40 326211.87 42912.16 26621.43 16290.73 10728.04 46488.17
Mewat 372387.24 45731.77 83297.15 216409.25 24090.84 1633.28 1224.96
Palwal 335815.70 38794.59 143863.28 123657.77 19397.30 7273.99 2828.77
Panchkula 221900.29 12005.80 35189.41 132063.79 41399.31 827.99 413.99
Panipat 313329.14 212797.82 70019.87 27382.07 3129.38 0.00 0.00
Rewari 393885.37 304346.40 65862.80 18940.94 3443.81 860.95 430.48
Rohtak 431198.23 0.00 9619.36 298618.37 112086.45 10037.59 836.47
Sirsa 1056868.09 494210.10 369129.72 116116.96 56632.48 11407.98 9370.84
Sonipat 524356.81 105508.39 93564.05 224951.86 88388.16 8759.19 3185.16
Yamunanagar 436881.64 9488.46 22277.25 172442.42 176155.30 47442.29 9075.92
Haryana 10925006.26 4184355.95 1682794.54 2722302.20 1729401.41 453037 .80 153114.40 Figure 36. Decadal Water Level Fluctuation
Source: GWC, HARYANA/ GIS Based (October 2013 - October 2023) Data Source-GWC, Haryana
Haryana Water Resources Atlas 56|