
Page 69 - Haryana Water Resources Atlas 2025
P. 69
Waterlogged Area (Post-monsoon)
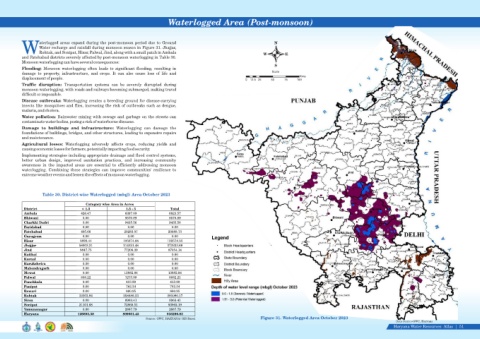
aterlogged areas expand during the post-monsoon period due to Ground N
Water recharge and rainfall during monsoon season in Figure 31. Jhajjar,
WRohtak, and Sonipat, Hisar, Palwal, Jind, along with a small patch in Ambala
W E
and Fatehabad districts severely affected by post-monsoon waterlogging in Table 30.
Monsoon waterlogging can have several consequences:
S
Flooding: Monsoon waterlogging often leads to significant flooding, resulting in
Scale
damage to property, infrastructure, and crops. It can also cause loss of life and
Kms
displacement of people.
0 12.5 25 50 75 100
Traffic disruption: Transportation systems can be severely disrupted during
monsoon waterlogging, with roads and railways becoming submerged, making travel
difficult or impossible.
Disease outbreaks: Waterlogging creates a breeding ground for disease-carrying
insects like mosquitoes and flies, increasing the risk of outbreaks such as dengue,
malaria, and cholera.
Water pollution: Rainwater mixing with sewage and garbage on the streets can
contaminate water bodies, posing a risk of waterborne diseases.
Damage to buildings and infrastructure: Waterlogging can damage the
foundations of buildings, bridges, and other structures, leading to expensive repairs
and maintenance.
Agricultural losses: Waterlogging adversely affects crops, reducing yields and
causing economic losses for farmers, potentially impacting food security.
Implementing strategies including appropriate drainage and flood control systems,
better urban design, improved sanitation practices, and increasing community
awareness in the impacted areas are essential to efficiently addressing monsoon
waterlogging. Combining these strategies can improve communities' resilience to
extreme weather events and lessen the effects of monsoon waterlogging.
Table 30. District-wise Waterlogged (mbgl) Area October 2023
Category wise Area in Acres
District < 1.5 1.5 - 3 Total
Ambala 426.47 6397.09 6823.57
Bhiwani 0.00 9570.89 9570.89
Charkhi Dadri 0.00 9435.56 9435.56
Faridabad 0.00 0.00 0.00
Fatehabad 405.66 20283.07 20688.73
Gurugram 0.00 0.00 0.00
Hisar 3899.44 105674.88 109574.33
Jhajjar 58002.21 214221.48 272223.69
Jind 9847.75 77206.39 87054.14
Kaithal 0.00 0.00 0.00
Karnal 0.00 0.00 0.00
Kurukshetra 0.00 0.00 0.00
Mahendragarh 0.00 0.00 0.00
Mewat 0.00 13882.86 13882.86
Palwal 808.22 7273.99 8082.21
Panchkula 0.00 413.99 413.99
Panipat 0.00 782.34 782.34
Rewari 0.00 860.95 860.95
Rohtak 32203.94 258886.23 291090.17
Sirsa 0.00 8963.41 8963.41
Sonipat 21101.68 72860.51 93962.19
Yamunanagar 0.00 2887.79 2887.79
Haryana 126695.38 809601.45 936296.83
Source: GWC, HARYANA/ GIS Based Figure 31. Waterlogged Area October 2023
Data Source-GWC, Haryana
Haryana Water Resources Atlas 51|