Page 70 - Haryana Water Resources Atlas 2025
P. 70

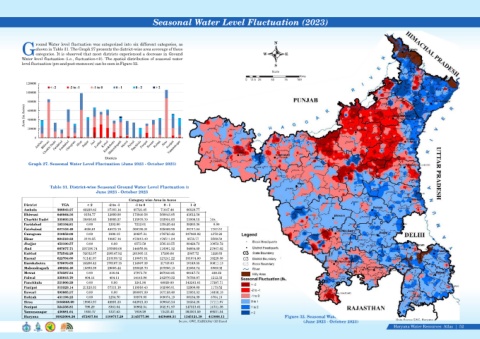
Seasonal Water Level Fluctuation (2023)


                   round Water level fluctuation was categorized into six different categories, as                                       N
                   shown in Table 31. The Graph 27 presents the district-wise area coverage of these
            Gcategories. It is observed that most districts experienced a decrease in Ground                                        W          E
            Water level fluctuation (i.e., fluctuation<0). The spatial distribution of seasonal water
            level fluctuation (pre and post-monsoon) can be seen in Figure 32.
                                                                                                                                         S
                                                                                                                                        Scale
                                                                                                                                                      Kms
                                                                                                                           0  12.5 25   50    75    100


               Graph 27. Seasonal Water Level Fluctuation (June 2023 - October 2023)


                          Table 31. District-wise Seasonal Ground Water Level Fluctuation (m),
                                                 June 2023 - October 2023


                                                                 Category wise Area in Acres

             District          TGA          < 2        -2 to -1     -1 to 0       0 - 1        1 -2        > 2

             Ambala          388943.27    42220.82    37103.14     85721.05      71647.44    66529.77    85721.05

             Bhiwani         848064.36     9154.77    12899.90     173940.58    568843.95    41612.58    41612.58

             Charkhi Dadri   332603.33    20836.85    16905.37     115978.70    152934.63    11008.15    14939.63


             Faridabad       183104.81      0.00       1202.00       7212.01    135425.44    39265.36      0.00


             Fatehabad       627152.49     4056.61      48273.70   308708.31    235689.26    22717.04     7707.57

             Gurugram        310858.09      0.00       1990.13      20697.34    176723.42    107068.92    4378.28

             Hisar           984219.22     3119.55      19887.16   472612.40    476511.84     8578.77     3509.50


             Jhajjar         453190.57      0.00        0.00         6573.58    356133.55    80429.73    10053.72


             Jind            667677.71    207196.74   135899.00    144958.94    116991.32    34664.09    27967.62

             Kaithal         572542.29    52012.07    298147.92    201905.11     17200.84     2047.72     1228.63

             Karnal          622704.60    51141.97    213159.72    110057.51    127241.22    101874.80   19229.38

             Kurukshetra     378070.65    24286.42    176167.15    114907.38     21749.03    10149.55    30811.13

             Mahendragarh    469252.40    15893.39    29005.44     189528.70    207806.10    21058.74     5960.02


             Mewat           372387.24      0.00       816.64        37973.70   267040.85    66147.73     408.32


             Palwal          335815.70     404.11      404.11       14143.86    242870.32    76780.97     1212.33
             Panchkula       221900.29      0.00        0.00         1241.98     60029.00    143241.61   17387.71


             Panipat         313329.14     21123.31     57111.18     118916.43  102096.01    12908.69     1173.52


             Rewari          393885.37      0.00        0.00       260007.39    107188.48    12053.32    14636.18

             Rohtak          431198.23      0.00       1254.70     58970.85     309074.19    58134.39     3764.10

             Sirsa           1056868.09   19963.97    48891.35     642921.30    309645.24    18334.26    17111.97

             Sonipat         524356.81     796.29      8361.04     50962.54     302191.97    147313.61   14731.36

             Yamunanagar     436881.64     1650.17     1237.63      7838.29      73432.42    263201.59   89521.54


             Haryana        10925006.26  473857.04   1108717.28   3145777.96   4438466.51   1345121.38  413066.13                             Figure 32. Seasonal Water Level Fluctuation
                                                                                                                                                                                                      Data Source-GWC, Haryana
                                                                                          Source: GWC, HARYANA/ GIS Based                               (June 2023 - October 2023)
                                                                                                                                                                                                     Haryana Water Resources  Atlas     52|
   65   66   67   68   69   70   71   72   73   74   75