
Page 71 - Haryana Water Resources Atlas 2025
P. 71
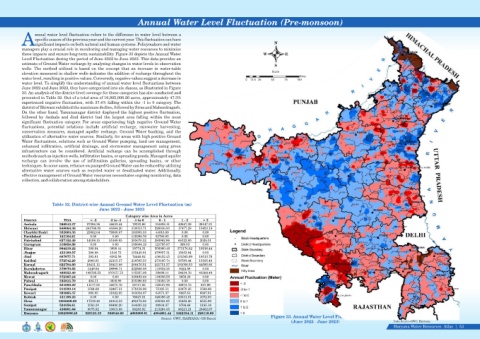
Annual Water Level Fluctuation (Pre-monsoon)


                  nnual water level fluctuation refers to the difference in water level between a
                  specific season of the previous year and the current year. This fluctuation can have
            Asignificant impacts on both natural and human systems. Policymakers and water                                               N
            managers play a crucial role in monitoring and managing water resources to minimize
            these impacts and ensure long-term sustainability. Figure 33 depicts the Annual Water                                   W          E
            Level Fluctuation during the period of June 2022 to June 2023. This data provides an
            estimate of Ground Water recharge by analyzing changes in water levels in observation
                                                                                                                                         S
            wells.  The  method  utilized  is  based  on  the  concept  that  an  increase  in  water-table
                                                                                                                                        Scale
            elevation measured in shallow wells indicates the addition of recharge throughout the
                                                                                                                                                      Kms
            water level, resulting in positive values. Conversely, negative values suggest a decrease in
                                                                                                                           0  12.5 25   50    75    100
            water level. To simplify the understanding of annual water level fluctuations between
            June 2022 and June 2023, they have categorized into six classes, as illustrated in Figure
            33. An analysis of the district-level coverage for these categories has also conducted and
            presented in Table 32. Out of a total area of 10,925,006.26 acres, approximately 47.3%
            experienced negative fluctuation, with 37.4% falling within the -1 to 0 category. The
            district of Bhiwani exhibited the maximum decline, followed by Sirsa and Mahendragarh.
            On the other hand, Yamunanagar district displayed the highest positive fluctuation,
            followed  by  Ambala  and  Jind  district  had  the  largest  area  falling  within  the  most
            significant  fluctuation  category.  For  areas  experiencing  high  negative  Ground  Water
            fluctuations,  potential  solutions  include  artificial  recharge,  rainwater  harvesting,
            conservation  measures,  managed  aquifer  recharge,  Ground  Water  banking,  and  the
            utilization of alternative water sources. Similarly, for areas with high positive Ground
            Water fluctuations, solutions such as Ground Water pumping, land use management,
            enhanced  infiltration,  artificial  drainage,  and  stormwater  management  using  green
            infrastructure  can  be  considered.  Artificial  recharge  can  be  accomplished  through
            methods such as injection wells, infiltration basins, or spreading ponds. Managed aquifer
            recharge  can  involve  the  use  of  infiltration  galleries,  spreading  basins,  or  other
            techniques. In some cases, reliance on pumped Ground Water can be reduced by utilizing
            alternative  water  sources  such  as  recycled  water  or  desalinated  water.  Additionally,
            effective management of Ground Water resources necessitates ongoing monitoring, data
            collection, and collaboration among stakeholders.


                           Table 32. District-wise Annual Ground Water Level Fluctuation (m)
                                                  June 2022 - June 2023


                                                               Category wise Area in Acres

             District            TGA          < -2       -2 to -1  -1 to 0      0 - 1      1 - 2      > 2


             Ambala            388943.27     27294.26  16632.44    79323.96   194898.11  42647.29   28147.21


             Bhiwani           848064.36     241769.08     40364.20    310013.71  228036.93  17477.28  10403.14


             Charkhi Dadri     332603.33     23982.04  79809.07   183993.33   44818.89     0.00      0.00

             Faridabad         183104.81      0.00       0.00       119398.76  63706.05    0.00      0.00


             Fatehabad         627152.49     14198.15    55169.95  205670.32  283962.96  66122.80    2028.31
             Gurugram          310858.09      0.00       0.00     188664.19   121795.87   398.03     0.00


             Hisar             984219.22     389.94      3899.44   39774.31   556060.46  373176.62  10918.44


             Jhajjar           453190.57     386.68      1546.73  155445.91   279957.31  15853.94    0.00


             Jind              667677.71     393.91    6302.56     74449.02   436452.45  131565.99  18513.78


             Kaithal           572542.29    2866.81    22115.37   210505.53   273165.74  50783.44   13105.40


             Karnal            622704.60     18411.11    36413.08  200476.51  221751.57  101056.53  44595.80


             Kurukshetra       378070.65     1449.94   28998.71   222565.08   115632.35   9424.58    0.00


             Mahendragarh      469252.40     149795.22     107677.73    115227.09  28608.11  24634.76    43309.49
             Mewat             372387.24      0.00       0.00     220492.44   149036.56   2858.24    0.00


             Palwal            335815.70     404.11    3636.99    215390.82   116383.78    0.00      0.00
             Panchkula         221900.29     11177.81    14075.76  56717.05   122127.96  16973.72    827.99


             Panipat           313329.14     1564.69    32467.31  179156.99   75105.11   23470.35   1564.69


             Rewari            393885.37     860.95     11622.85    303054.97  64571.37   6887.61   6887.61


             Rohtak            431198.23      0.00       0.00      78627.81   320366.48  30531.01   1672.93


             Sirsa            1056868.09     17519.40  28112.53   492172.96   495024.95  15482.26   8555.99


             Sonipat           524356.81     3583.30     66490.20  344395.32  99934.37    6768.46   3185.16


             Yamunanagar       436881.64     9075.92     13613.88  88283.92   213284.05  86221.21   26402.67


             Haryana          10925006.26   525123.33  568948.80  4083800.01  450468  1.44  1022334.11  220118.60
                                                                                                                                       Figure 33. Annual Water Level Fluctuation
                                                                                 Source: GWC, HARYANA/ GIS Based
                                                                                                                                                 (June 2022 - June 2023)                             Data Source-GWC, Haryana
                                                                                                                                                                                                     Haryana Water Resources  Atlas     53|