
Page 72 - Haryana Water Resources Atlas 2025
P. 72
Annual Water Level Fluctuation (Post-monsoon)
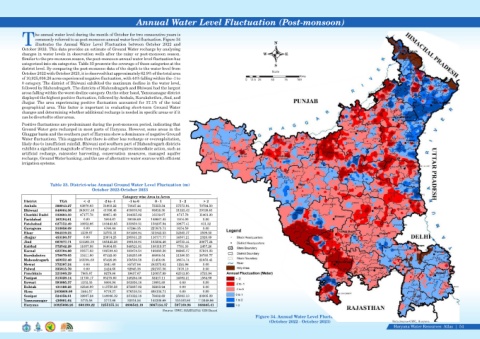
he annual water level during the month of October for two consecutive years is
commonly referred to as post-monsoon annual water level fluctuation. Figure 34
Tillustrates the Annual Water Level Fluctuation between October 2022 and N
October 2023. This data provides an estimate of Ground Water recharge by analyzing
changes in water levels in observation wells after the rainy or post-monsoon season. W E
Similar to the pre-monsoon season, the post-monsoon annual water level fluctuation has
categorized into six categories. Table 33 presents the coverage of these categories at the
S
district level. By comparing the post-monsoon data of the depth to the water level from
Scale
October 2022 with October 2023, it is observed that approximately 62.9% of the total area
Kms
of 10,925,006.26 acres experienced negative fluctuation, with 44% falling within the -1 to
0 12.5 25 50 75 100
0 category. The district of Bhiwani exhibited the maximum decline in the water level,
followed by Mahendragarh. The districts of Mahendragarh and Bhiwani had the largest
areas falling within the worst decline category. On the other hand, Yamunanagar district
displayed the highest positive fluctuation, followed by Ambala, Kurukshethra, Jind, and
Jhajjar. The area experiencing positive fluctuation accounted for 37.1% of the total
geographical area. This factor is important in evaluating short-term Ground Water
changes and determining whether additional recharge is needed in specific areas or if it
can be diverted to other areas.
Positive fluctuations are predominant during the post-monsoon period, indicating that
Ground Water gets recharged in most parts of Haryana. However, some areas in the
Ghaggar basin and the southern part of Haryana show a dominance of negative Ground
Water fluctuations. This suggests that there is either less recharge or overexploitation,
likely due to insufficient rainfall. Bhiwani and southern part of Mahendragarh districts
exhibits a significant magnitude of less recharge and requires immediate action, such as
artificial recharge, rainwater harvesting, conservation measures, managed aquifer
recharge, Ground Water banking, and the use of alternative water sources with efficient
irrigation systems.
Table 33. District-wise Annual Ground Water Level Fluctuation (m)
October 2022-October 2023
Category wise Area in Acres
District TGA < -2 -2 to -1 -1 to 0 0 - 1 1 - 2 > 2
Ambala 388943.27 63970.93 51603.22 71647.44 73353.34 57573.84 70794.50
Bhiwani 848064.36 243017.46 41196.45 419870.92 93628.30 21222.42 29128.81
Charkhi Dadri 332603.33 47177.78 88851.48 164335.92 16119.07 4717.78 11401.30
Faridabad 183104.81 0.00 2804.67 29248.69 148647.45 2404.00 0.00
Fatehabad 627152.49 10952.86 103443.65 333859.31 158207.94 19877.41 811.32
Gurugram 310858.09 0.00 6766.44 67266.35 227670.71 9154.59 0.00
Hisar 984219.22 2339.67 32755.31 581406.84 331842.53 32365.37 3509.50
Jhajjar 453190.57 0.00 23974.25 295811.25 116777.77 14307.21 2320.09
Jind 667677.71 151261.50 165442.26 198136.81 103204.46 28755.44 20877.24
Kaithal 572542.29 11057.68 94604.63 348521.81 108119.57 7781.33 2457.26
Karnal 622704.60 39277.03 106784.43 182474.54 169382.20 96965.17 27821.23
Kurukshetra 378070.65 13411.90 67422.00 148255.89 88808.54 21386.55 38785.77
Mahendragarh 469252.40 163304.60 85426.98 158536.59 21456.08 18674.74 21853.41
Mewat 372387.24 0.00 2041.60 85747.06 283373.62 1224.96 0.00
Palwal 335815.70 0.00 2424.66 92945.38 232767.56 7678.10 0.00
Panchkula 221900.29 7865.87 8279.86 19457.67 120057.99 62512.95 3725.94
Panipat 313329.14 11735.17 85275.60 148254.36 52417.11 14082.21 1564.69
Rewari 393885.37 2152.38 9900.94 362030.16 19801.89 0.00 0.00
Rohtak 431198.23 12546.99 113759.38 272687.92 32203.94 0.00 0.00
Sirsa 1056868.09 2444.57 9778.27 576510.54 468134.71 0.00 0.00
Sonipat 524356.81 19907.24 148906.19 231322.18 78832.69 25083.13 20305.39
Yamunanagar 436881.64 5775.58 3712.88 20214.54 142326.88 151402.80 113448.96
Haryana 10925006.26 808199.22 1255155.14 4808542.19 3087134.37 597169.98 368805.41
Source: GWC, HARYANA/ GIS Based
Figure 34. Annual Water Level Fluctuation
(October 2022 - October 2023) Data Source-GWC, Haryana
Haryana Water Resources Atlas 54|