
Page 42 - Haryana Water Resources Atlas 2025
P. 42
District-wise Average Rainfall
onthly average rainfall is the average amount of rainfall that occurs in an area during all the
days of a particular month. The monthly average rainfall graph of an area can be used in several
Mways, including:
Agricultural Planning
A Farmers can use the monthly average rainfall data to plan their crop planting and harvesting
schedules. They can also use it to determine the types of crops to plant depending on the amount of
rainfall received each month.
Water Resource Management
B The data can be used by water resource managers to determine the amount of water available in
the area and to plan for its distribution and use.
Disaster Preparedness
C The monthly average rainfall graph can be used to predict and prepare for natural disasters such
as floods and landslides, which can be caused by heavy rainfall.
Environmental Studies
D Researchers can use the data to study the impact of rainfall on the local environment, including
soil erosion, vegetation growth, and water quality.
Tourism Planning
E Tourist destinations that are affected by seasonal rainfall can use the data to plan for peak seasons
and prepare for adverse weather conditions.
Overall, the monthly average rainfall graph is a valuable tool for decision-makers and researchers who need to understand the
patterns and trends of rainfall in a particular area in particular season.
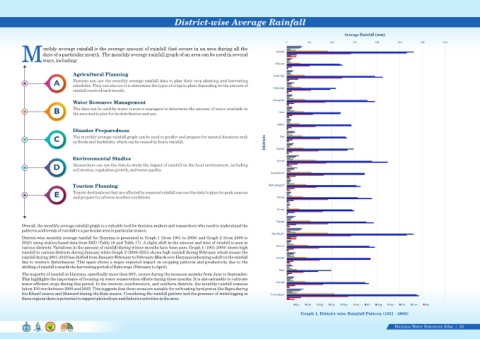
District-wise monthly average rainfall for Haryana is presented in Graph 1 (from 1951 to 2000) and Graph 2 (from 2000 to
2023) using station-based data from IMD (Table 16 and Table 17). A slight shift in the amount and time of rainfall is seen in
various districts. Variations in the amount of rainfall during winter months have been seen. Graph 1 (1951-2000) shows high
rainfall in various districts during January while Graph 2 (2000-2023) shows high rainfall during February which means the
rainfall during 2001-2023 has shifted from January-February to February-March over Haryana indicating a shift in the rainfall
due to western disturbances. This again shows a major expected impact on cropping patterns and productivity due to the
shifting of rainfall towards the harvesting period of Rabi crops (February to April).
The majority of rainfall in Haryana, specifically more than 80%, occurs during the monsoon months from June to September.
This highlights the importance of focusing on water conservation efforts during these months. It is also advisable to cultivate
water-efficient crops during this period. In the western, southwestern, and southern districts, the monthly rainfall remains
below 150 mm between 2000 and 2023. This suggests that these areas are suitable for cultivating hard grains like Bajra during
the Kharif season and Mustard during the Rabi season. Considering the rainfall pattern and the presence of waterlogging in
these regions there is potential to support pisciculture and fisheries activities in the area.
Graph 1. District-wise Rainfall Pattern (1951 - 2000)
Haryana Water Resources Atlas 24|