
Page 44 - Haryana Water Resources Atlas 2025
P. 44
District-Wise Rainfall Probability
ainfall probability refers to the likelihood or chance of rainfall occurring within a specific area during a particular period
or a particular range. It is usually expressed as a percentage or a decimal, and it is based on the analysis of past weather
Rpatterns, current atmospheric conditions, and other factors that affect precipitation. For instance, if the probability of
rainfall is 68%, it means that there is a 68% chance of rainfall occurring withinone standard deviation (SD) from the mean
rainfall. Rainfall probability can provide valuable information for a wide range of stakeholders, helping them make informed
decisions in response to rainfall patterns like weather forecasting, disaster management, agricultural planning, crop selection,
and planning rainwater harvesting structures in terms of both site and capacity.
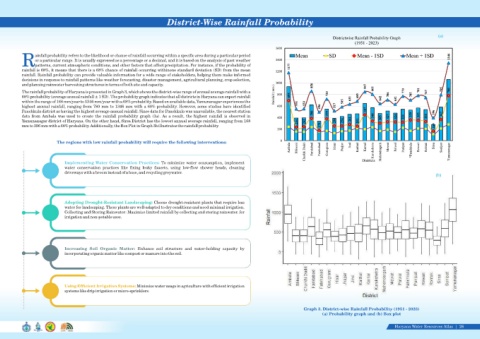
The rainfall probability of Haryana is presented in Graph 3, which shows the district-wise range of annual average rainfall with a
68% probability (average annual rainfall ± 1 SD). The probability graph indicates that all districts in Haryana can expect rainfall
within the range of 168 mm/year to 1346 mm/year with a 68% probability. Based on available data, Yamunanagar experiences the
highest annual rainfall, ranging from 780 mm to 1346 mm with a 68% probability. However, some studies have identified
Panchkula district as having the highest average annual rainfall. Since data for Panchkula was unavailable, the nearest station
data from Ambala was used to create the rainfall probability graph (3a). As a result, the highest rainfall is observed in
Yamunanagar district of Haryana. On the other hand, Sirsa District has the lowest annual average rainfall, ranging from 168
mm to 396 mm with a 68% probability. Additionally, the Box Plot in Graph 3b illustrates the rainfall probability.
The regions with low rainfall probability will require the following interventions:
Implementing Water Conservation Practices: To minimize water consumption, implement
water conservation practices like fixing leaky faucets, using low-flow shower heads, cleaning
driveways with a broom instead of a hose, and recycling greywater.
Adopting Drought-Resistant Landscaping: Choose drought-resistant plants that require less
water for landscaping. These plants are well-adapted to dry conditions and need minimal irrigation.
Collecting and Storing Rainwater: Maximize limited rainfall by collecting and storing rainwater. for
irrigation and non-potable uses.
Increasing Soil Organic Matter: Enhance soil structure and water-holding capacity by
incorporating organic matter like compost or manure into the soil.
Using Efficient Irrigation Systems: Minimize water usage in agriculture with efficient irrigation
systems like drip irrigation or micro-sprinklers.
Graph 3. District-wise Rainfall Probability (1951 - 2023)
(a) Probability graph and (b) Box plot
Haryana Water Resources Atlas 26|