
Page 38 - Haryana Water Resources Atlas 2025
P. 38
Fence Diagram
fence diagram is a three-dimensional representation used in N
hydrogeology to illustrate the spatial and vertical distribution of
Ahydraulic conductivity, transmissivity, and Ground Water quality
W E
within an aquifer. An aquifer refers to a permeable layer of rock, soil, or
sediment that contains water and can transmit it to wells or springs. Hydraulic
conductivity measures the aquifer's ability to transmit water, while S
transmissivity measures its ability to transmit water under a hydraulic Scale
gradient. These values are obtained through pumping tests and other available Kms
data, which are then used to create a fence diagram. 0 12.5 25 50 75 100
The fence diagram divides the hydraulic conductivity and/or transmissivity
values into equal intervals or zones, which are plotted against the vertical
depth of the aquifer. The resulting graph consists of horizontal bars
representing each zone, with the width of each bar indicating the zone's
thickness and the height representing the depth of different zones.
Fence diagrams are valuable tools for understanding the distribution of
Ground Water and its properties within an aquifer. They aid in the design and
management of Ground Water resources, such as well placement, aquifer
recharge, Ground Water remediation, and the development of Ground Water
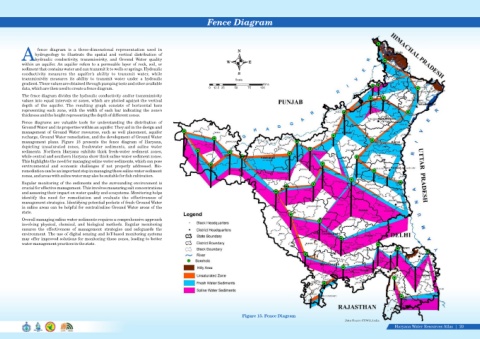
management plans. Figure 15 presents the fence diagram of Haryana,
depicting unsaturated zones, freshwater sediments, and saline water
sediments. Northern Haryana exhibits thick fresh-water sediment zones,
while central and southern Haryana show thick saline water sediment zones.
This highlights the need for managing saline water sediments, which can pose
environmental and economic challenges if not properly addressed. Bio-
remediation can be an important step in managing these saline water sediment
zones, and areas with saline water may also be suitable for fish cultivation.
Regular monitoring of the sediments and the surrounding environment is
crucial for effective management. This involves measuring salt concentrations
and assessing their impact on water quality and ecosystems. Monitoring helps
identify the need for remediation and evaluate the effectiveness of
management strategies. Identifying potential pockets of fresh Ground Water
in saline areas can be helpful for central/saline Ground Water areas of the
state.
Overall managing saline water sediments requires a comprehensive approach
involving physical, chemical, and biological methods. Regular monitoring
ensures the effectiveness of management strategies and safeguards the
environment. The use of digital sensing and IoT-based monitoring systems
may offer improved solutions for monitoring these zones, leading to better
water management practices in the state.
Figure 15. Fence Diagram
Data Source-CGWB, India
Haryana Water Resources Atlas 20|