
Page 41 - Haryana Water Resources Atlas 2025
P. 41
Rainfall Departure Frequency (1951-2020)
ainfall departure is the difference between the actual and expected
precipitation over a specific period. The Expected precipitation, known as
RNormal R/F, is based on 50-year historical averages, while the Actual R/F
represents recorded rainfall in 2020. Rainfall departures are important for assessing N
impacts on agriculture, water resources, and industries dependent on rainfall
patterns. Tools like weather satellites, rain gauges, and computer models are used to W E
track and analyze rainfall departures. In the Indian context, a simple method is
adopted to calculate rainfall departures which is depicted below as follows:
S
Departure (As %) = (Actual R/F – Normal R/F) × 100 / Normal R/F
Scale
An important parameter called rainfall departure frequency may be obtained using Kms
the rainfall departure data. Rainfall departure frequency refers to the frequency with 0 12.5 25 50 75 100
which a region experiences a departure from its average or normal rainfall levels. The
formula for calculating rainfall departure frequency is as follows:
Rainfall Departure Frequency = Count (Departure % of category x)
Where x refers to any of the departure categories mentioned in Table 15.
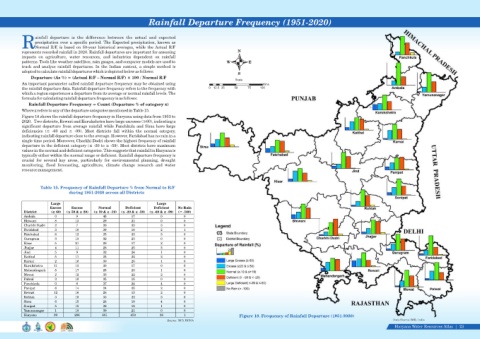
Figure 18 shows the rainfall departure frequency in Haryana using data from 1951 to
2020. Two districts, Rewari and Kurukshetra have large excesses (≥60), indicating a
significant departure from average rainfall while Panchkula and Sirsa have large
deficiencies (≤ -60 and ≥ -99). Most districts fall within the normal category,
indicating rainfall departure close to the average. However, Faridabad has no rain in a
single time period. Moreover, Charkhi Dadri shows the highest frequency of rainfall
departure in the deficient category (≤ -20 to ≥ -59). Most districts have maximum
values in the normal and deficient categories. This suggests that rainfall in Haryana is
typically either within the normal range or deficient. Rainfall departure frequency is
crucial for several key areas, particularly for environmental planning, drought
monitoring, flood forecasting, agriculture, climate change research and water
resource management.
Table 15. Frequency of Rainfall Departure % from Normal to R/F
during 1951-2020 across all Districts
Large Large
Excess Excess Normal Deficient Deficient No Rain
District (≥ 60) (≤ 59 & ≥ 20) (≤ 19 & ≥ -19) (≤ -20 & ≥ -59) (≤ -60 & ≥ -99) (= -100)
Ambala 0 9 45 17 0 0
Bhiwani 8 13 29 21 0 0
Charkhi Dadri 2 7 26 33 3 0
Faridabad 3 10 39 16 2 1
Fatehabad 8 12 25 23 3 0
Gurugram 3 13 32 23 0 0
Hisar 5 21 26 17 2 0
Jhajjar 4 11 28 25 3 0
Jind 5 9 32 24 1 0
Kaithal 5 17 25 22 2 0
Karnal 2 18 30 20 1 0
Kurukshetra 11 13 30 17 0 0
Mahendragarh 5 17 25 23 1 0
Mewat 2 12 33 22 2 0
Palwal 3 18 35 15 0 0
Panchkula 0 6 37 24 4 0
Panipat 6 14 24 25 2 0
Rewari 12 16 28 13 2 0
Rohtak 3 10 33 22 3 0
Sirsa 6 15 28 18 4 0
Sonipat 5 15 32 18 1 0
Yamunanagar 1 10 39 21 0 0
Haryana 99 286 681 459 36 1 Figure 18. Frequency of Rainfall Departure (1951-2020)
Source: IMD, INDIA Data Source-IMD, India
Haryana Water Resources Atlas 23|