
Page 45 - Haryana Water Resources Atlas 2025
P. 45
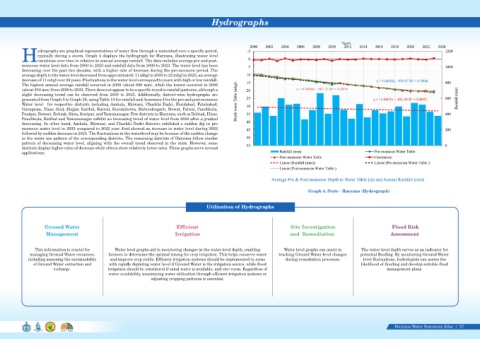
Hydrographs


                    ydrographs are graphical representations of water flow through a watershed over a specific period,
                    typically during a storm. Graph 4 displays the hydrograph for Haryana, illustrating water level
            Hvariations over time in relation to annual average rainfall. The data includes average pre and post-
            monsoon water level data from 2000 to 2023 and rainfall data from 2000 to 2023. The water level has been
            decreasing over the past two decades, with a higher rate of decrease during the pre-monsoon period. The
            average depth to the water level decreased from approximately 11 mbgl in 2000 to 22 mbgl in 2023, an average
            decrease of 11 mbgl over 22 years. Fluctuations in the water level correspond to years with high or low rainfall.
            The highest annual average rainfall occurred in 2008 (about 689 mm), while the lowest occurred in 2006
            (about 354 mm) from 2000 to 2023. There does not appear to be a specific trend in rainfall patterns, although a
            slight  decreasing  trend  can  be  observed  from  2000  to  2023.  Additionally,  district-wise  hydrographs  are
            presented from Graph 5 to Graph 26, using Table 18 for rainfall and Annexure-I for the pre and post-monsoon
            Water  level    for  respective  districts  including  Ambala,  Bhiwani,  Charkhi  Dadri,  Faridabad,  Fatehabad,
            Gurugram, Hisar, Jind, Jhajjar, Kaithal, Karnal, Kurukshetra, Mahendragarh, Mewat, Palwal, Panchkula,
            Panipat, Rewari, Rohtak, Sirsa, Sonipat, and Yamunanagar. Few districts in Haryana, such as Rohtak, Hisar,
            Panchkula, Kaithal and Yamunanagar exhibit an increasing trend of water level from 2022 after a gradual
            decreasing. In other hand, Ambala, Bhiwani, and Charkhi Dadri districts exhibited a sudden dip in pre
            monsoon water level in 2023 compared to 2022 year. Jind showed an increase in water level during 2022
            followed by sudden decrease in 2023. The fluctuations in the waterlevel may be because of the sudden change
            in the water use pattern of the corresponding districts. The remaining districts of Haryana follow similar
            pattern of decreasing water level, aligning with the overall trend observed in the state. However, some
            districts display higher rates of decrease while others show relatively lower rates. These graphs serve several
            applications:


                                                                                                                                                          Graph 4. State - Haryana (Hydrograph)


                                                                                                       Utilization of Hydrographs


                       Ground Water                                                      Efficient                                               Site Investigation                                 Flood Risk
                        Management                                                      Irrigation                                               and  Remediation                                  Assessment


                  This information is crucial for         Water level graphs aid in monitoring changes in the water level depth, enabling     Water level graphs can assist in      The water level depth serves as an indicator for
                managing Ground Water resources,       farmers to determine the optimal timing for crop irrigation. This helps conserve water   tracking Ground Water level changes   potential flooding. By monitoring Ground Water
               including assessing the sustainability   and improve crop yields. Efficient irrigation systems should be implemented in areas   during remediation processes.         level fluctuations, hydrologists can assess the
                 of Ground Water extraction and        with rapidly depleting water level if Ground Water is the irrigation source, while flood                                     likelihood of flooding and develop suitable flood
                            recharge.                  irrigation should be considered if canal water is available, and vice versa. Regardless of                                                management plans.
                                                       water availability, maximizing water utilization through efficient irrigation systems or
                                                                            adjusting cropping patterns is essential.


                                                                                                                                                                                                     Haryana Water Resources Atlas     27|