
Page 39 - Haryana Water Resources Atlas 2025
P. 39
Rainfall Isohyetal
N
ainfall is the outcome of water vapour condensing and precipitating,
resulting in droplets that descend from clouds due to gravity. It plays a
Rsignificant role in the water cycle and is considered an input component. W E
As temperatures rise, the atmosphere's capacity to hold water also increases.
Consequently, the recent temperature increase caused by climate change can S
have a profound impact on rainfall and its distribution. It is thus anticipated that
Scale
wet areas will become wetter, dry areas will become drier, and storms will
Kms
intensify, leading to more erratic weather worldwide. Tropical countries like 0 12.5 25 50 75 100
India face serious threats from climate-driven events. The Indo-Gangetic region,
which has fertile soil and is crucial for food production, is expected to be severely
affected by rising temperatures. Therefore, isohyetal maps are essential for
monitoring changes in rainfall patterns.
The isohyetal method is a graphical technique that involves drawing lines of
equal rainfall over an area based on point measurements using interpolation
methods and existing rainfall records from weather stations. Isohyetal maps are
valuable tools in hydrology, meteorology, agriculture, and environmental science
as they provide useful information about precipitation patterns, trends, and
spatial distribution of rainfall, that may be used to guide decision-making and
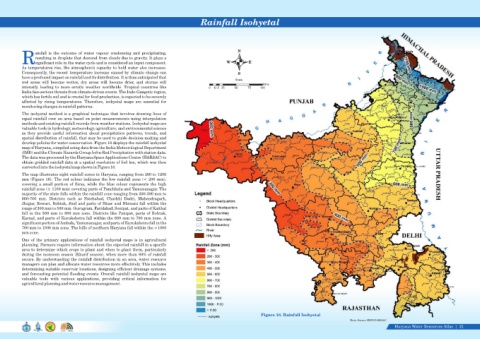
develop policies for water conservation. Figure 16 displays the rainfall isohyetal
map of Haryana, compiled using data from the India Meteorological Department
(IMD) and the Climate Hazards Group Infra-Red Precipitation with station data.
The data was processed by the Haryana Space Applications Centre (HARSAC) to
obtain gridded rainfall data at a spatial resolution of 5x5 km, which was then
converted into the isohyetal map shown in Figure 16.
The map illustrates eight rainfall zones in Haryana, ranging from 200 to 1200
mm (Figure 16). The red colour indicates the low rainfall zone (< 200 mm),
covering a small portion of Sirsa, while the blue colour represents the high
rainfall zone (≥ 1100 mm) covering parts of Panchkula and Yamunanagar. The
majority of the state falls within the rainfall zone ranging from 200-300 mm to
600-700 mm. Districts such as Fatehabad, Charkhi Dadri, Mahendragarh,
Jhajjar, Rewari, Rohtak, Jind and parts of Hisar and Bhiwani fall within the
range of 300 mm to 500 mm. Gurugram, Faridabad, Sonipat, and parts of Kaithal
fall in the 500 mm to 600 mm zone. Districts like Panipat, parts of Rohtak,
Karnal, and parts of Kurukshetra fall within the 600 mm to 700 mm zone. A
significant portion of Ambala, Yamunanagar, and parts of Kurukshetra fall in the
700 mm to 1000 mm zone. The hills of northern Haryana fall within the >1000
mm zone.
One of the primary applications of rainfall isohyetal maps is in agricultural
planning. Farmers require information about the expected rainfall in a specific
area to determine which crops to plant and when to plant them, particularly
during the monsoon season (Kharif season), when more than 80% of rainfall
occurs. By understanding the rainfall distribution in an area, water resource
managers can plan and allocate water resources more effectively. This includes
determining suitable reservoir locations, designing efficient drainage systems,
and forecasting potential flooding events. Overall rainfall isohyetal maps are
valuable tools with various applications, providing critical information for
agricultural planning and water resource management.
Figure 16. Rainfall Isohyetal
Data Source-IMD/HARSAC
Haryana Water Resources Atlas 21|