
Page 29 - Haryana Water Resources Atlas 2025
P. 29
Soil Health
oil health refers to the overall condition of soil, encompassing its physical, chemical,
and biological properties. A healthy soil is capable of sustaining plant and animal N
Sproductivity, preserving or improving water and air quality, and supporting diverse
communities of organisms, ranging from bacteria to larger mammals. Soil health maps serve W E
as valuable tools for agricultural planning, soil conservation planning, land use planning,
and natural resource management. For instance, areas with poor soil quality require
conservation practices like cover cropping or reduced tillage to enhance soil health and crop S
productivity. Similarly, regions with shallow soils or high erosion potential may be less Scale
suitable for development, while areas with deep and fertile soils may be more suitable for Kms
agriculture. Soil health is often quantified using a soil health index, which represents the 0 12.5 25 50 75 100
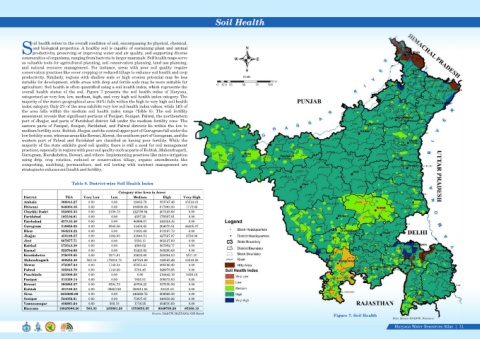
overall health status of the soil. Figure 7 presents the soil health index of Haryana,
categorized as very low, low, medium, high, and very high soil health index category. The
majority of the state's geographical area (84%) falls within the high to very high soil health
index category. Only 2% of the area exhibits very low soil health index values, while 14% of
the area falls within the medium soil health index range (Table 8). The soil fertility
assessment reveals that significant portions of Panipat, Sonipat, Palwal, the northeastern
part of Jhajjar, and parts of Faridabad district fall under the medium fertility zone. The
eastern parts of Panipat, Sonipat, Faridabad, and Palwal districts lie within the low to
medium fertility zone. Rohtak, Jhajjar, and the central upper part of Gurugram fall under the
low fertility zone, whereas areas like Rewari, Mewat, the southern part of Gurugram, and the
western part of Palwal and Faridabad are classified as having poor fertility. While the
majority of the state exhibits good soil quality, there is still a need for soil management
practices, especially in regions with poor soil quality such as parts of Rohtak, Mahendragarh,
Gurugram, Kurukshetra, Rewari, and others. Implementing practices like micro-irrigation
using drip, crop rotation, reduced or conservation tillage, organic amendments like
composting, mulching, permaculture, and soil testing with nutrient management are
strategies to enhance soil health and fertility.
Table 8. District-wise Soil Health Index
Category wise Area in Acres
District TGA Very Low Low Medium High Very High
Ambala 388943.27 0.00 0.00 19685.78 353747.48 15510.01
Bhiwani 848064.36 0.00 0.00 168909.08 677982.30 1172.98
Charkhi Dadri 332603.33 0.00 2739.73 122739.94 207123.66 0.00
Faridabad 183104.81 0.00 0.00 4507.20 178597.61 0.00
Fatehabad 627152.49 0.00 0.00 86898.07 540254.42 0.00
Gurugram 310858.09 0.00 8945.56 51436.95 204070.51 46405.07
Hisar 984219.22 0.00 0.00 11021.49 973197.72 0.00
Jhajjar 453190.57 0.00 1092.03 21840.51 427527.97 2730.06
Jind 667677.71 0.00 0.00 5550.11 662127.60 0.00
Kaithal 572542.29 0.00 0.00 4589.52 567952.77 0.00
Karnal 622704.60 0.00 0.00 53423.92 569280.68 0.00
Kurukshetra 378070.65 0.00 2571.91 22632.80 350294.03 2571.91
Mahendragarh 469252.40 563.33 178011.71 147591.99 129565.49 13519.88
Mewat 372387.24 0.00 1149.34 85051.41 286186.49 0.00
Palwal 335815.70 0.00 1140.29 5701.45 328973.95 0.00
Panchkula 221900.29 0.00 0.00 0.00 218442.10 3458.19
Panipat 313329.14 0.00 0.00 7655.51 305673.63 0.00
Rewari 393885.37 0.00 6594.73 49760.25 337530.39 0.00
Rohtak 431198.23 0.00 32853.20 360211.85 38133.18 0.00
Sirsa 1056868.09 0.00 0.00 246969.72 809898.36 0.00
Sonipat 524356.81 0.00 0.00 75697.45 448659.36 0.00
Yamunanagar 436881.64 0.00 592.78 1778.35 434510.50 0.00
Haryana 10925006.26 563.33 235691.28 1553653.35 9049730.20 85368.10
Source: DA&FW, HARYANA/ GIS Based
Figure 7. Soil Health
Data Source-DA&FW, Haryana
Haryana Water Resources Atlas 11|