
Page 140 - Haryana Water Resources Atlas 2025
P. 140
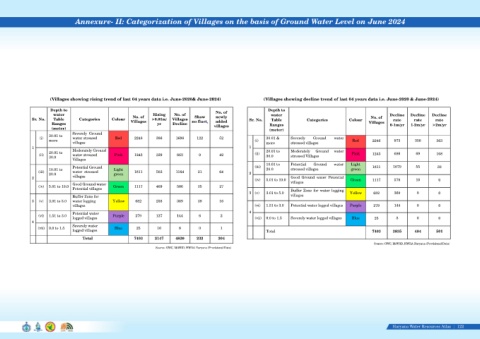
Annexure- II: Categorization of Villages on the basis of Ground Water Level on June 2024


                          (Villages showing rising trend of last 04 years data i.e. June-2020& June-2024)                           (Villages showing decline trend of last 04 years data i.e. June-2020 & June-2024)


                          Depth to                                                                          No. of                    Depth to

                           water                                   No. of    Rising    No. of     Show      newly                      water                                                      Decline    Decline   Decline

                 Sr. No.   Table        Categories      Colour              >0.01m/   Villages                               Sr. No.    Table            Categories           Colour     No. of     rate          rate            rate
                           Ranges                                 Villages     yr      Decline  no fluct.   added                      Ranges                                           Villages   0-1m/yr   1-2m/yr    >2m/yr
                                                                                                           villages
                           (meter)                                                                                                     (meter)
                                     Severely  Ground
                         30.01 to
                     (i)             water stressed       Red       2246      386       1686       122        52                     30.01 &     Severely   Ground     water
                         more                                                                                                  (i)                                              Red       2246       973       350        363
                                     villages                                                                                        more        stressed villages
                 1                                                                                                           1
                         20.01 to    Moderately Ground                                                                               20.01 to     Moderately   Ground   water
                    (ii)             water stressed       Pink      1243      329        863        9         42               (ii)  30.0        stressed Villages             Pink       1243       686       69         108
                         30.0
                                     Villages

                                                                                                                                     10.01 to      Potential   Ground   water    Light

                                     Potential Ground                                                                          (iii)                                                      1811      1079       55         30
                         10.01 to                        Light                                                                       20.0        stressed villages             green
                    (iii)            water  stressed                1811      562       1164       21         64
                         20.0                            green                                                               2
                 2                   villages                                                                                                    Good  Ground  water  Potential

                                                                                                                               (iv)  5.01 to 10.0                              Green      1117       576       10          0
                                     Good Ground water                                                                                           villages
                    (iv)    5.01 to 10.0                   Green      1117      469      586       35         27

                                     Potential villages                                                                                          Buffer  Zone  for  water  logging
                                                                                                                             3 (v)     3.01 to 5.0                             Yellow     682         369        0           0

                                     Buffer Zone for                                                                                             villages
                 3  (v)  3.01 to 5.0  water logging      Yellow     682       258        369       39         16

                                     villages                                                                                  (vi)  1.51 to 3.0  Potential water logged villages  Purple  279       144        0          0

                                     Potential water                                                                         4
                    (vi)  1.51 to 3.0                    Purple     279       127        144        6         2
                                     logged villages                                                                           (vii)  0.0 to 1.5  Severely water logged villages  Blue     25         8         0          0
                 4
                                     Severely water
                    (vii)  0.0 to 1.5                     Blue       25        16         8         0         1
                                     logged villages                                                                                 Total                                                7403      3835       484       501

                                          Total                    7403       2147      4820       232       204
                                                                                                                                                                                           Source: GWC, I&WRD, HWRA Haryana (Provisional Data)
                                                                              Source: GWC, I&WRD, HWRA Haryana (Provisional Data)


                                                                                                                                                                                                    Haryana Water Resources Atlas     122|