
Page 137 - Haryana Water Resources Atlas 2025
P. 137
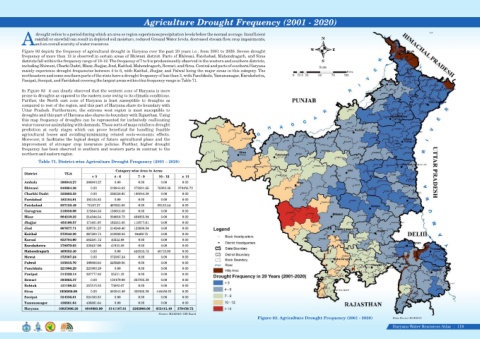
Agriculture Drought Frequency (2001 - 2020)


                   drought refers to a period during which an area or region experiences precipitation levels below the normal average. Insufficient
                  rainfall or snowfall can result in depleted soil moisture, reduced Ground Water levels, decreased stream flow, crop impairments,               N
            Aand an overall scarcity of water resources.
                                                                                                                                                           W          E
            Figure 93 depicts the frequency of agricultural drought in Haryana over the past 20 years i.e., from 2001 to 2020. Severe drought
            frequency of more than 13 is observed in certain areas of Bhiwani district. Parts of Bhiwani, Fatehabad, Mahendragarh, and Sirsa
            districts fall within the frequency range of 10-12. The frequency of 7 to 9 is predominantly observed in the western and southern districts,         S
            including Bhiwani, Charki Dadri, Hisar, Jhajjar, Jind, Kaithal, Mahendragarh, Rewari, and Sirsa. Central and parts of southern Haryana             Scale
            mainly experience drought frequencies between 4 to 6, with Kaithal, Jhajjar, and Palwal being the major areas in this category. The                              Kms
            northeastern and some southern parts of the state have a drought frequency of less than 3, with Panchkula, Yamunanagar, Kurukshetra,   0  12.5 25   50    75    100
            Panipat, Sonipat, and Faridabad covering the largest areas within this frequency range in Table 71.


            In Figure 93   it can clearly observed that the western zone of Haryana is more
            prone to droughts as opposed to the eastern zone owing to its climatic conditions.
            Further,  the  North  east  zone  of  Haryana  is  least  susceptible  to  draughts  as
            compared to rest of the region, and this part of Haryana share its boundary with
            Uttar  Pradesh.  Furthermore,  the  extreme  west  region  is  most  susceptible  to
            droughts and this part of Haryana also shares its boundary with Rajasthan. Using
            this map frequency of droughts can be represented for inclusively reallocating
            water resources assimilating with demands. These sorts of maps reinforce drought
            prediction  at  early  stages  which  can  prove  beneficial  for  handling  feasible
            agricultural  losses  and  avoiding/minimizing  related  socio-economic  effects.
            Moreover,  it  facilitates  the  logical  design  of  future  agricultural  plans  and  the
            improvement  of  stronger  crop  insurance  policies.  Further,  higher  drought
            frequency has been observed in southern and western parts in contrast to the
            northern and eastern region.

                    Table 71. District-wise Agriculture Drought Frequency (2001 – 2020)


                                                                                Source: HARSAC/ GIS Based
                                                                                                                                 Figure 93. Agriculture Drought Frequency (2001 - 2020)             Data Source-HARSAC

                                                                                                                                                                                                    Haryana Water Resources Atlas     119|