
Page 124 - Haryana Water Resources Atlas 2025
P. 124
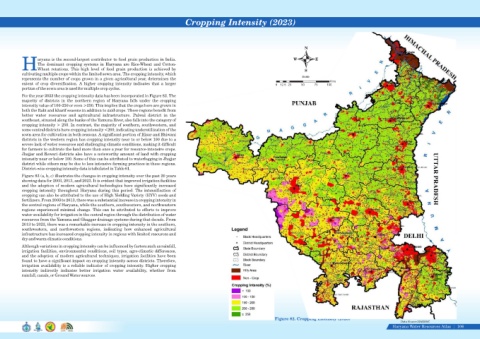
Cropping Intensity (2023)


                                                                                                                                                        N


                    aryana is the second-largest contributor to food grain production in India.                                                    W         E
                    The  dominant  cropping  systems  in  Haryana  are  Rice-Wheat  and  Cotton-
            HWheat  rotations.  This  high  level  of  food  grain  production  is  achieved  by                                                        S
            cultivating multiple crops within the limited sown area. The cropping intensity, which
            represents the number of crops grown in a given agricultural year, determines the                                                          Scale
                                                                                                                                                                     Kms
            extent  of  crop  diversification.  A  higher  cropping  intensity  indicates  that  a  larger                                0  12.5 25   50    75    100
            portion of the sown area is used for multiple crop cycles.
            For the year 2023 the cropping intensity data has been incorporated in Figure 82. The
            majority  of  districts  in  the  northern  region  of  Haryana  falls  under  the  cropping
            intensity value of 100-250 or even >250. This implies that the crops here are grown in
            both the Rabi and kharif seasons in addition to zaid crops. These regions benefit from
            better  water  resources  and  agricultural  infrastructure.  Palwal  district  in  the
            southeast, situated along the banks of the Yamuna River, also falls into the category of
            cropping intensity > 250. In contrast, the majority of southern, southwestern, and
            some central districts have cropping intensity <200, indicating underutilization of the
            sown area for cultivation in both seasons. A significant portion of Hisar and Bhiwani
            districts in the western region has cropping intensity near to or below 100 due to a
            severe lack of water resources and challenging climatic conditions, making it difficult
            for farmers to cultivate the land more than once a year for resource-intensive crops.
            Jhajjar and Rewari districts also have a noteworthy amount of land with cropping
            intensity near or below 100. Some of this can be attributed to waterlogging in Jhajjar
            district while others may be due to less intensive farming practices in these regions.
            District-wise cropping intensity data is tabulated in Table 61.
            Figure 83 (a, b, c) illustrates the changes in cropping intensity over the past 20 years
            showing data for 2003, 2013, and 2023. It is evident that improved irrigation facilities
            and the adoption of modern agricultural technologies have significantly increased
            cropping  intensity  throughout  Haryana  during  this  period.  The  intensification  of
            cropping can also be attributed to the use of High Yielding Variety (HYV) seeds and
            fertilizers. From 2003 to 2013, there was a substantial increase in cropping intensity in
            the central regions of Haryana, while the southern, southwestern, and northwestern
            regions experienced minimal change. This can be attributed to efforts to improve
            water availability for irrigation in the central region through the distribution of water
            resources from the Yamuna and Ghaggar drainage systems during that decade. From
            2013 to 2023, there was a remarkable increase in cropping intensity in the southern,
            southwestern,  and  northwestern  regions,  indicating  how  enhanced  agricultural
            infrastructure has increased cropping intensity in regions with limited resources and
            dry and warm climatic conditions.
            Although variations in cropping intensity can be influenced by factors such as rainfall,
            irrigation facilities, environmental conditions, soil types, agro-climatic differences,
            and the adoption of modern agricultural techniques, irrigation facilities have been
            found to have a significant impact on cropping intensity across districts. Therefore,
            irrigation availability is a reliable indicator of cropping intensity. Higher cropping
            intensity  indirectly  indicates  better  irrigation  water  availability,  whether  from
            rainfall, canals, or Ground Water sources.


                                                                                                                                         Figure 82. Cropping Intensity (2023)
                                                                                                                                                                                                        Data Source-HARSAC
                                                                                                                                                                                                    Haryana Water Resources Atlas     106|