Page 23 - Haryana Water Resources Atlas 2025
P. 23

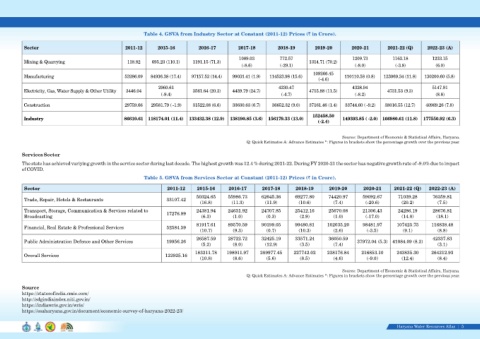
Table 4. GSVA from Industry Sector at Constant (2011-12) Prices (` in Crore).


             Sector                                            2011-12         2015-16              2016-17            2017-18             2018-19           2019-20           2020-21           2021-22 (Q)         2022-23 (A)


                                                                                                                        1089.03             772.57                              1209.73             1163.18            1233.15
             Mining & Quarrying                                 118.82      695.23 (110.1)       1191.15 (71.3)                                           1314.71 (70.2)
                                                                                                                         (-8.6)             (-29.1)                              (-8.0)              (-3.8)              (6.0)
                                                                                                                                                            109266.45
             Manufacturing                                     53286.09     84936.38 (17.4)     97157.52 (14.4)     99031.41 (1.9)     114523.98 (15.6)                     110110.58 (0.8)    123069.34 (11.8)     130200.60 (5.8)
                                                                                                                                                               (-4.6)
                                                                                2960.61                                                    4230.47                              4328.94                                5147.91
             Electricity, Gas, Water Supply & Other Utility    3446.04                           3561.64 (20.3)     4439.79 (24.7)                        4715.88 (11.5)                         4731.53 (9.3)
                                                                                 (-9.4)                                                     (-4.7)                               (-8.2)                                  (8.8)

             Construction                                      29759.66     29581.79 ( -1.9)     31522.08 (6.6)     33630.63 (6.7)      36652.32 (9.0)    37161.46 (1.4)    33744.60 ( -9.2)    38016.55 (12.7)     40969.26 (7.8)

                                                                                                                                                            152458.50
             Industry                                          86610.61  118174.01 (11.4)   133432.38 (12.9)   138190.85 (3.6)   156179.33 (13.0)                          149393.85 ( -2.0)  166980.61 (11.8)   177550.92 (6.3)
                                                                                                                                                               (-2.4)


                                                                                                                                                                           Source: Department of Economic & Statistical Affairs, Haryana.
                                                                                                                           Q: Quick Estimates A: Advance Estimates *: Figures in brackets show the percentage growth over the previous year.

            Services Sector

            The state has achieved variying growth in the service sector during last decade. The highest growth was 12.4 % during 2021-22. During FY 2020-21 the sector has negative growth rate of -9.0% due to impact
            of COVID.
                                                                        Table 5. GSVA from Services Sector at Constant (2011-12) Prices (` in Crore).


             Sector                                                                 2011-12        2015-16        2016-17          2017-18          2018-19         2019-20          2020-21         2021-22 (Q)      2022-23 (A)
                                                                                                  50324.65        55986.73         62645.36        69277.80         74420.97         59092.67          71039.28         76359.81
             Trade, Repair, Hotels & Restaurants                                    33107.42
                                                                                                    (16.8)          (11.3)          (11.9)           (10.6)           (7.4)           (-20.6)           (20.2)            (7.5)

             Transport, Storage, Communication & Services related to                17276.89      24381.94        24631.92         24707.85        25412.16         25670.08         21306.43          24286.19         28676.81
             Broadcasting                                                                            (6.3)          (1.0)            (0.3)            (2.9)           (1.0)           (-17.0)           (14.0)           (18.1)

                                                                                                  81917.61        89570.59         90199.05        99480.81        102035.20         98481.97         107425.75        116838.48
             Financial, Real Estate & Professional Services                         52584.59
                                                                                                    (10.7)          (9.3)            (0.7)           (10.3)           (2.6)            (-3.5)            (9.1)            (8.8)

                                                                                                  26587.59        28722.72         32425.19        33571.24         36050.59                                            42337.83
             Public Administration Defence and Other Services                       19956.26                                                                                      37972.04 (5.3)  41084.09 (8.2)
                                                                                                     (5.2)          (8.0)           (12.9)            (3.5)           (7.4)                                               (3.1)
                                                                                                  183211.78      198911.97        209977.45        227742.02       238176.84        216853.10         243835.30        264212.93
             Overall Services                                                      122925.16
                                                                                                    (10.8)          (8.6)            (5.6)            (8.5)           (4.6)            (-9.0)           (12.4)            (8.4)

                                                                                                                                                                           Source: Department of Economic & Statistical Affairs, Haryana.
                                                                                                                           Q: Quick Estimates A: Advance Estimates *: Figures in brackets show the percentage growth over the previous year.


            Source
            https://statesofindia.cmie.com/
            http://sdgindiaindex.niti.gov.in/
            https://indiawris.gov.in/wris/
            https://esaharyana.gov.in/document/economic-survey-of-haryana-2022-23/


                                                                                                                                                                                                      Haryana Water Resources Atlas     5|
   18   19   20   21   22   23   24   25   26   27   28