Page 21 - Haryana Water Resources Atlas 2025
P. 21

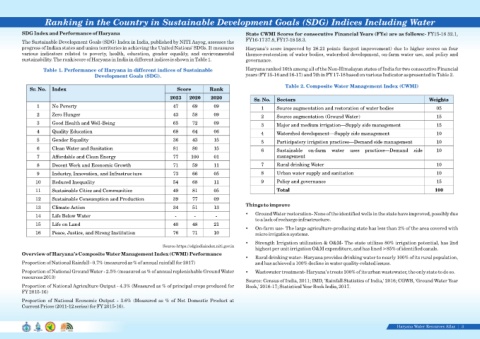
Ranking in the Country in Sustainable Development Goals (SDG) Indices Including Water


            SDG Index and Performance of Haryana                                                                           State CWMI Scores for consecutive Financial Years (FYs) are as follows:- FY15-16 32.1,
                                                                                                                           FY16-17 37.8, FY17-18 58.3.
            The Sustainable Development Goals (SDG) Index in India, published by NITI Aayog, assesses the
            progress of Indian states and union territories in achieving the United Nations' SDGs. It measures             Haryana’s score improved by 26.21 points (largest improvement) due to higher scores on four
            various  indicators  related  to  poverty,  health,  education,  gender  equality,  and  environmental         themes-restoration of water bodies, watershed development, on-farm water use, and policy and
            sustainability. The rank/score of Haryana in India in different indices is shown in Table 1.                   governance.

                      Table 1. Performance of Haryana in different indices of Sustainable                                  Haryana ranked 16th among all of the Non-Himalayan states of India for two consecutive Financial
                                                Development Goals (SDG).                                                   years (FY 15-16 and 16-17) and 7th in FY 17-18 based on various Indicator as presented in Table 2.

                                                                                                                                               Table 2. Composite Water Management Index (CWMI)
                Sr. No.  Index                                                           Score           Rank

                                                                                     2023      2020       2020
                                                                                                                               Sr. No.  Sectors                                                                       Weights
                   1       No Poverty                                                  47       69         09
                                                                                                                                   1      Source augmentation and restoration of water bodies                             05
                   2       Zero Hunger                                                 43       58         09
                                                                                                                                   2      Source augmentation (Ground Water)                                              15
                   3       Good Health and Well-Being                                  65       72         09
                                                                                                                                   3      Major and medium irrigation—Supply side management                              15
                   4       Quality Education                                           68       64         06
                                                                                                                                   4      Watershed development—Supply side management                                    10
                   5       Gender Equality                                             36       43         15
                                                                                                                                   5      Participatory irrigation practices—Demand side management                       10
                   6       Clean Water and Sanitation                                  81       80         15
                                                                                                                                   6      Sustainable  on-farm  water  uses  practices—Demand  side                       10
                   7       Affordable and Clean Energy                                 77       100        01                             management

                   8       Decent Work and Economic Growth                             71       59         11                      7      Rural drinking Water                                                            10
                   9       Industry, Innovation, and Infrastructure                    73       66         05                      8      Urban water supply and sanitation                                               10

                   10      Reduced Inequality                                          54       68         11                      9      Policy and governance                                                           15
                   11      Sustainable Cities and Communities                          49       81         05                             Total                                                                          100

                   12      Sustainable Consumption and Production                      39       77         09
                                                                                                                           Things to improve
                   13      Climate Action                                              34       51         13
                                                                                                                           Ÿ    Ground Water restoration- None of the identified wells in the state have improved, possibly due
                   14      Life Below Water                                             -        -          -
                                                                                                                                to a lack of recharge infrastructure.
                   15      Life on Land                                                40       48         21
                                                                                                                           Ÿ    On-farm use- The large agriculture-producing state has less than 2% of the area covered with
                   16      Peace, Justice, and Strong Institution                      76       71         10                   micro irrigation systems.

                                                                                                                           Ÿ    Strength Irrigation utilization & O&M- The state utilizes 80% irrigation potential, has 2nd
                                                                                  Source-https://sdgindiaindex.niti.gov.in
                                                                                                                                highest per unit irrigation O&M expenditure, and has lined >85% of identified canals.
            Overview of Haryana’s Composite Water Management Index (CWMI) Performance
                                                                                                                           Ÿ    Rural drinking water- Haryana provides drinking water to nearly 100% of its rural population,
            Proportion of National Rainfall - 0.7% (measured as % of annual rainfall for 2017)                                  and has achieved a 100% decline in water quality-related issues.

            Proportion of National Ground Water - 2.5% (measured as % of annual replenishable Ground Water                 Ÿ    Wastewater treatment- Haryana’s treats 100% of its urban wastewater, the only state to do so.
            resources 2013)
                                                                                                                           Source: Census of India, 2011; IMD, 'Rainfall Statistics of India,' 2016; CGWB, 'Ground Water Year
            Proportion of National Agriculture Output - 4.3% (Measured as % of principal crops produced for                Book,' 2016-17; Statistical Year Book India, 2017.
            FY 2015-16)

            Proportion of National Economic Output - 3.6% (Measured as % of Net Domestic Product at
            Current Prices (2011-12 series) for FY 2015-16).


                                                                                                                                                                                                      Haryana Water Resources Atlas     3|
   16   17   18   19   20   21   22   23   24   25   26