
Page 22 - Haryana Water Resources Atlas 2025
P. 22
An Economic Overview
When the state of Haryana was formed its Economy was known as agrarian because of its rich culture and agricultural prosperity. Haryana contributes a significant amount of wheat and rice to the Central
Pool i.e. a national repository system of surplus food grain. Between the fourth and tenth five-year plans, the average annual growth rate for the industry and service sectors was larger than for the
agriculture and related sectors. Haryana's major industries include automotive, information technology, agriculture, and petrochemicals. Being a preferred destination for auto majors and auto-component
manufacturers, the State is the largest automobile hub in the country. The Panipat Refinery situated at Panipat is the 2nd largest refinery in South Asia. The State Government has committed to creating a
progressive business environment. With Haryana’s structural transformation from an entirely agrarian State to an industrial State and services sector recording robust growth, the State has shown
progressive development towards achieving sustainable development goals. Though Haryana is geographically a small state covering only 1.3% area of the country, the contribution of the State to the
National Gross Domestic Product at constant (2011-12) prices has been estimated as 3.9% as per Quick Estimates 2021-22 and Advance Estimates of 2022-23 also.
As per the advance estimates for the year 2022-23, the Gross State Domestic Product (GSDP) of the State at current prices has been estimated as ` 9,94,154.08 crore, recording the growth of 14.2% in 2022-
23 as compared to the growth of 17.4% recorded in 2021-22. The per capita income has increased quite significantly and reach upto the ` 229065 in 2020-21 at current prices.
Agriculture and Allied Sectors
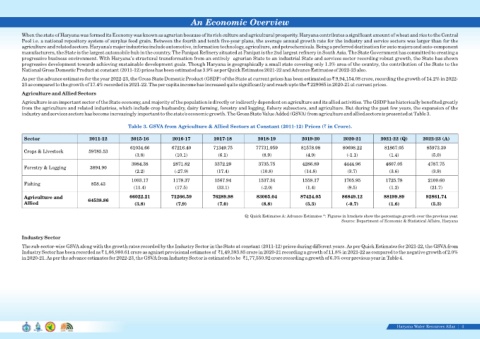
Agriculture is an important sector of the State economy, and majority of the population is directly or indirectly dependent on agriculture and its allied activities. The GSDP has historically benefited greatly
from the agriculture and related industries, which include crop husbandry, dairy farming, forestry and logging, fishery subsectors, and agriculture. But during the past few years, the expansion of the
industry and services sectors has become increasingly important to the state's economic growth. The Gross State Value Added (GSVA) from agriculture and allied sectors is presented at Table 3.
Table 3. GSVA from Agriculture & Allied Sectors at Constant (2011-12) Prices (` in Crore).
Sector 2011-12 2015-16 2016-17 2017-18 2018-19 2019-20 2020-21 2021-22 (Q) 2022-23 (A)
61034.66 67216.40 71349.75 77731.959 81578.98 80698.22 81867.05 85973.39
Crops & Livestock 59785.53
(3.8) (10.1) (6.1) (8.9) (4.9) (-1.1) (1.4) (5.0)
3984.38 2871.82 3372.29 3735.75 4286.89 4444.96 4607.05 4787.75
Forestry & Logging 3894.90
(2.2) (-27.9) (17.4) (10.8) (14.8) (3.7) (3.6) (3.9)
1003.17 1178.37 1567.94 1537.34 1558.17 1705.95 1725.78 2100.60
Fishing 858.43
(11.4) (17.5) (33.1) (-2.0) (1.4) (9.5) (1.2) (21.7)
Agriculture and 64538.86 66022.21 71266.59 76289.98 83005.04 87424.05 86849.12 88199.89 92861.74
Allied (3.8) (7.9) (7.0) (8.8) (5.3) (-0.7) (1.6) (5.3)
Q: Quick Estimates A: Advance Estimates *: Figures in brackets show the percentage growth over the previous year.
Source: Department of Economic & Statistical Affairs, Haryana
Industry Sector
The sub-sector-wise GSVA along with the growth rates recorded by the Industry Sector in the State at constant (2011-12) prices during different years. As per Quick Estimates for 2021-22, the GSVA from
Industry Sector has been recorded as ` 1,66,980.61 crore as against provisional estimates of `1,49,393.85 crore in 2020-21 recording a growth of 11.8% in 2021-22 as compared to the negative growth of 2.0%
in 2020-21. As per the advance estimates for 2022-23, the GSVA from Industry Sector is estimated to be `1,77,550.92 crore recording a growth of 6.3% over previous year in Table 4.
Haryana Water Resources Atlas 4|