
Page 57 - Haryana Water Resources Atlas 2025
P. 57
Surface Runoff
urface runoff refers to the movement of water over the Earth's surface when excess N
rainwater, meltwater, or other sources of water cannot be absorbed by the soil.
SSurface runoff follows various pathways depending on the topography of the land. W E
It may flow along the surface, collect in depressions to form puddles or channel into
natural water bodies.
S
The data in Table 21 provides insights into the annual average surface runoff for each
Scale
district in Haryana. Notable anomalies and variations can be observed across the
Kms
districts. The district with the lowest average surface runoff is Sirsa, recording only 42 0 12.5 25 50 75 100
mm/year, while Panchkula exhibits the highest average runoff at 661 mm/year.
Furthermore, the standard deviation values indicate the degree of variability within each
district. Districts like Panchkula, Karnal, Kurukshetra, and Yamunanagar show
relatively high standard deviations, suggesting significant fluctuations in surface runoff.
Karnal stands out with an unusually high maximum surface runoff of 461 mm/year,
contributing to its elevated average of 233 mm/year, indicating potential local factors
influencing runoff patterns. Conversely, districts like Sirsa and Fatehabad display lower
standard deviations, signifying more consistent runoff patterns. These variations in
surface runoff can be attributed to diverse geographical features, land use patterns, and
climatic conditions across Haryana, underscoring the need for tailored water resource
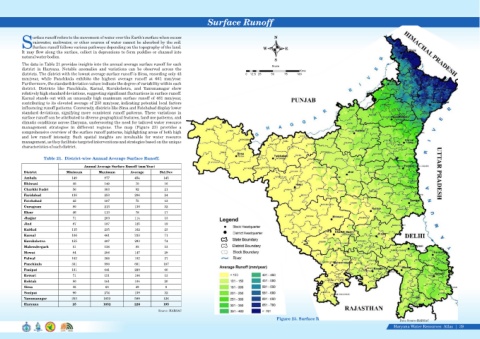
management strategies in different regions. The map (Figure 23) provides a
comprehensive overview of the surface runoff patterns, highlighting areas of both high
and low runoff intensity. Such spatial insights are invaluable for water resource
management, as they facilitate targeted interventions and strategies based on the unique
characteristics of each district.
Table 21. District-wise Annual Average Surface Runoff.
Annual Average Surface Runoff (mm/Year)
District Minimum Maximum Average Std.Dev
Ambala 149 877 454 145
Bhiwani 38 149 70 16
Charkhi Dadri 56 303 92 21
Faridabad 138 253 206 24
Fatehabad 43 107 75 13
Gurugram 80 213 130 32
Hisar 46 113 78 17
Jhajjar 71 203 114 13
Jind 87 187 125 19
Kaithal 115 235 162 23
Karnal 106 461 233 71
Kurukshetra 155 497 293 74
Mahendergarh 51 136 82 13
Mewat 84 206 147 29
Palwal 102 266 182 27
Panchkula 331 990 661 187
Panipat 131 641 220 60
Rewari 71 151 106 13
Rohtak 80 161 104 20
Sirsa 25 62 42 8
Sonipat 90 274 159 32
Yamunanagar 203 1052 599 126
Haryana 25 1052 226 195
Source: HARSAC
Figure 23. Surface Runoff
Data Source-HARSAC
Haryana Water Resources Atlas 39|