
Page 52 - Haryana Water Resources Atlas 2025
P. 52
Temperature
he degree or intensity of heat present in the atmosphere near the earth’s surface is
measured in temperature. The molecular movement of particles composed of a N
Tsubstance is represented by heat, and the temperature is measured in terms of the
degrees of hot (or cold) of a thing (or a place). The temperature of the air in any region W E
depends on the latitude of the place, altitude of the place, distance from the sea, air-mass
and Oceanic Currents, local aspects. District wise long term temperature variations have S
been outlined for the years 1970-2000 from the Table 19 with highest, lowest and average
Scale
temperature over the years. These temperature variations (measured in 0C) are crucial to
Kms
understand the climatic conditions prevalent across the region. 0 12.5 25 50 75 100
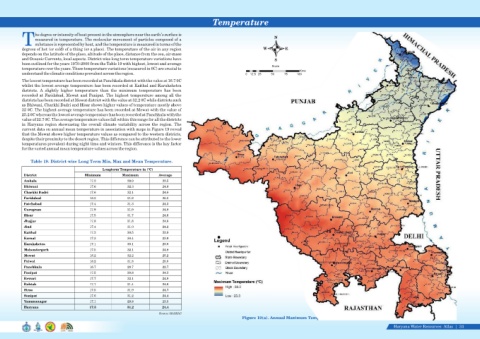
The lowest temperature has been recorded at Panchkula district with the value at 16.7 0C
whilst the lowest average temperature has been recorded at Kaithal and Kurukshetra
districts. A slightly higher temperature than the minimum temperature has been
recorded at Faridabad, Mewat and Panipat. The highest temperature among all the
districts has been recorded at Mewat district with the value at 32.2 0C while districts such
as Bhiwani, Charkhi Dadri and Hisar shows higher values of temperature mostly above
32 0C. The highest average temperature has been recorded at Mewat with the value of
25.2 0C whereas the lowest average temperature has been recorded at Panchkula with the
value of 22.7 0C. The average temperature values fall within this range for all the districts
in Haryana region showcasing the overall climate variability across the region. The
current data on annual mean temperature in association with maps in Figure 19 reveal
that the Mewat shows higher temperature values as compared to the western districts,
despite their proximity to the desert region. This difference can be attributed to the lower
temperatures prevalent during night time and winters. This difference is the key factor
for the varied annual mean temperature values across the region.
Table 19. District-wise Long Term Min, Max and Mean Temperature.
Longterm Temperature in (°C)
District Minimum Maximum Average
Ambala 17.2 29.9 23.5
Bhiwani 17.6 32.3 24.9
Charkhi Dadri 17.6 32.1 24.8
Faridabad 18.3 31.8 25.0
Fatehabad 17.4 31.3 24.3
Gurugram 17.9 31.9 24.9
Hisar 17.5 31.7 24.6
Jhajjar 17.8 31.8 24.8
Jind 17.4 31.0 24.2
Kaithal 17.2 30.5 23.9
Karnal 17.3 30.4 23.9
Kurukshetra 17.1 30.1 23.6
Mahendergarh 17.5 32.1 24.8
Mewat 18.2 32.2 25.2
Palwal 18.2 31.8 25.0
Panchkula 16.7 28.7 22.7
Panipat 17.5 30.8 24.2
Rewari 17.7 32.1 24.9
Rohtak 17.7 31.4 24.6
Sirsa 17.5 31.9 24.7
Sonipat 17.6 31.2 24.4
Yamunanagar 17.1 29.8 23.5
Haryana 17.5 31.2 24.4
Source: HARSAC
Figure 19(a). Annual Maximum Temperature Data Source-HARSAC
Haryana Water Resources Atlas 34|