
Page 58 - Haryana Water Resources Atlas 2025
P. 58
Soil Moisture 2023
N
W E
S
Scale
Kms
0 12.5 25 50 75 100
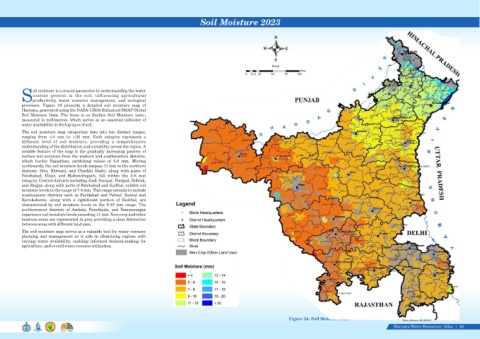
oil moisture is a crucial parameter in understanding the water
content present in the soil, influencing agricultural
Sproductivity, water resource management, and ecological
processes. Figure 24 presents a detailed soil moisture map of
Haryana, generated using the NASA-USDA Enhanced SMAP Global
Soil Moisture Data. The focus is on Surface Soil Moisture (ssm),
measured in millimetres, which serves as an essential indicator of
water availability in the top layer of soil.
The soil moisture map categorizes data into ten distinct ranges,
ranging from <4 mm to >20 mm. Each category represents a
different level of soil moisture, providing a comprehensive
understanding of the distribution and variability across the region. A
notable feature of the map is the gradually increasing pattern of
surface soil moisture from the western and southwestern districts,
which border Rajasthan, exhibiting values of 5-6 mm. Moving
northwards, the soil moisture levels surpass 11 mm in the northern
districts. Sira, Bhiwani, and Charkhi Dadri, along with parts of
Fatehabad, Hisar, and Mahendragarh, fall within the 5-6 mm
category. Central districts including Jind, Sonipat, Panipat, Rohtak,
and Jhajjar, along with parts of Fatehabad and Kaithal, exhibit soil
moisture levels in the range of 7-8 mm. This range extends to include
southeastern districts such as Faridabad and Palwal. Karnal and
Kurukshetra, along with a significant portion of Kaithal, are
characterized by soil moisture levels in the 9-10 mm range. The
northernmost districts of Ambala, Panchkula, and Yamunanagar
experience soil moisture levels exceeding 11 mm. Non-crop and other
land-use areas are represented in grey, providing a clear distinction
between areas with different land uses.
The soil moisture map serves as a valuable tool for water resource
planning and management as it aids in identifying regions with
varying water availability, enabling informed decision-making for
agriculture, and overall water resource utilization.
Figure 24. Soil Moisture 2023
Data Source-HARSAC
Haryana Water Resources Atlas 40|