
Page 59 - Haryana Water Resources Atlas 2025
P. 59
Ponds and Waterbodies
onds and other water bodies are typically found in confined areas like
valleys, basins, or depressions in the landscape. They can occur N
Pnaturally through geological processes or can be artificially created by
excavating a depression and lining it with waterproof materials. Ponds come W E
in various sizes, ranging from small garden ponds to larger bodies of water
used for fishing or recreation. Their depth, shape, and water quality differ S
depending on the location and surrounding environment. Ponds serve as
Scale
crucial habitats for diverse aquatic plants and animals, including fish,
Kms
amphibians, insects, and birds. However, ponds are vulnerable to pollution 0 12.5 25 50 75 100
resulting from human activities such as agriculture, industry, and urban
development. It is essential to recognize the value of ponds and take
measures to protect and preserve them. This includes implementing
sustainable practices in nearby land use, managing pollution sources, and
promoting awareness about the importance of maintaining healthy pond
ecosystems.
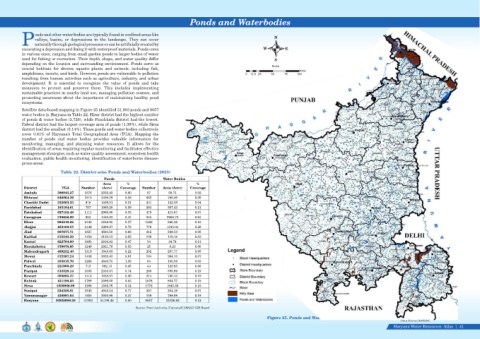
Satellite data-based mapping in Figure 25 identified 31,903 ponds and 9057
water bodies in Haryana in Table 22. Hisar district had the highest number
of ponds & water bodies (3,726), while Panchkula district had the lowest.
Palwal district had the largest coverage area of ponds (1.38%), while Sirsa
district had the smallest (0.14%). These ponds and water bodies collectively
cover 0.61% of Haryana's Total Geographical Area (TGA). Mapping the
number of ponds and water bodies provides valuable information for
monitoring, managing, and planning water resources. It allows for the
identification of areas requiring regular monitoring and facilitates effective
management strategies, such as water quality assessment, ecosystem health
evaluation, public health monitoring, identification of waterborne disease-
prone areas.
Table 22. District-wise Ponds and Waterbodies (2023)
Ponds Water Bodies
Area % %
District TGA Number (Acre) Coverage Number Area (Acre) Coverage
Ambala 388943.27 1676 2332.43 0.60 67 58.71 0.02
Bhiwani 848064.36 1818 2409.29 0.28 662 786.49 0.09
Charkhi Dadri 332603.33 818 1036.51 0.31 231 142.39 0.04
Faridabad 183104.81 757 1085.20 0.59 263 387.43 0.21
Fatehabad 627152.49 1111 2065.60 0.33 473 411.67 0.07
Gurugram 310858.09 953 1450.92 0.47 245 2906.70 0.94
Hisar 984219.22 2140 3618.95 0.37 1586 946.36 0.10
Jhajjar 453190.57 2149 3299.37 0.73 776 1315.04 0.29
Jind 667677.71 1827 4564.50 0.68 312 349.33 0.05
Kaithal 572542.29 1450 3132.12 0.55 109 119.14 0.02
Karnal 622704.60 1895 2916.83 0.47 54 34.74 0.01
Kurukshetra 378070.65 1249 2021.78 0.53 25 8.21 0.00
Mahendragarh 469252.40 1319 1048.63 0.22 202 257.77 0.05
Mewat 372387.24 1436 3023.43 0.81 104 264.13 0.07
Palwal 335815.70 1288 4649.75 1.38 94 105.56 0.03
Panchkula 221900.29 713 992.15 0.45 44 123.83 0.06
Panipat 313329.14 1035 2310.07 0.74 260 595.89 0.19
Rewari 393885.37 1314 1038.07 0.26 214 740.13 0.19
Rohtak 431198.23 1789 3596.00 0.83 1078 804.77 0.19
Sirsa 1056868.09 1566 1502.76 0.14 1772 1645.38 0.16
Sonipat 524356.81 1945 4045.14 0.77 327 354.19 0.07
Yamunanagar 436881.64 1655 2050.96 0.47 159 768.98 0.18
Haryana 10925006.26 31903 54190.48 0.50 9057 13126.82 0.12
Source: Pond Authority, Haryana/HARSAC/ GIS Based
Figure 25. Ponds and Waterbodies
Data Source-HARSAC
Haryana Water Resources Atlas 41|