
Page 98 - Haryana Water Resources Atlas 2025
P. 98
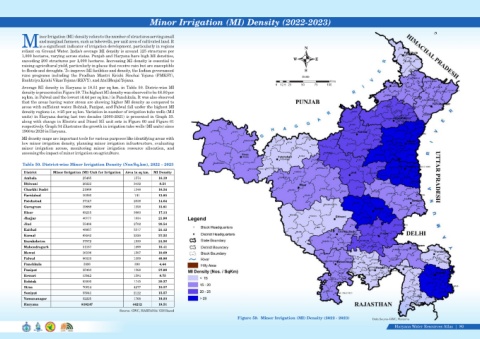
Minor Irrigation (MI) Density (2022-2023)


                    inor Irrigation (MI) density refers to the number of structures serving small
                    and marginal farmers, such as tubewells, per unit area of cultivated land. It
            Mis a significant indicator of irrigation development, particularly in regions                                                              N
            reliant on Ground Water. India's average MI density is around 125 structures per
            1,000 hectares, varying across states. Punjab and Haryana have high MI densities,
            exceeding 200 structures per 1,000 hectares. Increasing MI density is essential to                                                     W         E
            raising agricultural yield, particularly in places that receive rain but are susceptible
            to floods and droughts. To improve MI facilities and density, the Indian government                                                         S
            runs  programs  including  the  Pradhan  Mantri  Krishi  Sinchai  Yojana  (PMKSY),                                                         Scale
            Rashtriya Krishi Vikas Yojana (RKVY), and Atal Bhujal Yojana.                                                                                            Kms
                                                                                                                                          0  12.5 25   50    75    100
            Average MI density in Haryana is 18.51 per sq km. in Table 50. Distric-wise MI
            density is presented in Figure 59. The highest MI density was observed to be 48.80 per
            sq km. in Palwal and the lowest (4.44 per sq km.) in Panchkula. It was also observed
            that the areas having water stress are showing higher MI density as compared to
            areas with sufficient water. Rohtak, Panipat, and Palwal fall under the highest MI
            density regions i.e. ≥25 per sq km. Variation in number of irrigation tube wells (M.I
            units) in Haryana during last two decades (2000-2021) is presented in Graph 33.
            along with change in Electric and Diesel MI unit sets in Figure 60 and Figure 61
            respectively. Graph 34 illustrates the growth in irrigation tube wells (MI units) since
            1966 to 2020 in Haryana.
            MI density maps are important tools for various purposes like identifying areas with
            low minor irrigation density, planning minor irrigation infrastructure, evaluating
            minor  irrigation  access,  monitoring  minor  irrigation  resource  allocation,  and
            assessing the impact of minor irrigation on agriculture.

            Table 50. District-wise Minor Irrigation Density (Nos/Sq.km), 2022 – 2023

             District      Minor Irrigation (MI) Unit for Irrigation   Area in sq km.   MI Density
             Ambala                       25485                    1574         16.19
             Bhiwani                      29222                    3432         8.51
             Charkhi Dadri                21988                    1346         16.34
             Faridabad                    10260                     741         13.85
             Fatehabad                    37147                    2538         14.64
             Gurugram                     19889                    1258         15.81
             Hisar                        68215                    3983         17.13
             Jhajjar                      40171                    1834         21.90
             Jind                         55486                    2702         20.54
             Kaithal                      48937                    2317         21.12
             Karnal                       68582                    2520         27.22
             Kurukshetra                  37572                    1530         24.56
             Mahendragarh                 31167                    1899         16.41
             Mewat                        16108                    1507         10.69
             Palwal                       66323                    1359         48.80
             Panchkula                    3990                      898         4.44
             Panipat                      35483                    1268         27.98
             Rewari                       13942                    1594         8.75
             Rohtak                       53000                    1745         30.37
             Sirsa                        70014                    4277         16.37
             Sonipat                      33041                    2122         15.57
             Yamunanagar                  32225                    1768         18.23
             Haryana                     818247                    44212        18.51
                                                            Source: GWC, HARYANA/ GIS Based
                                                                                                                       Figure 59.  Minor Irrigation (MI) Density (2022 - 2023)            Data Source-GWC, Haryana

                                                                                                                                                                                                     Haryana Water Resources Atlas     80|