
Page 101 - Haryana Water Resources Atlas 2025
P. 101
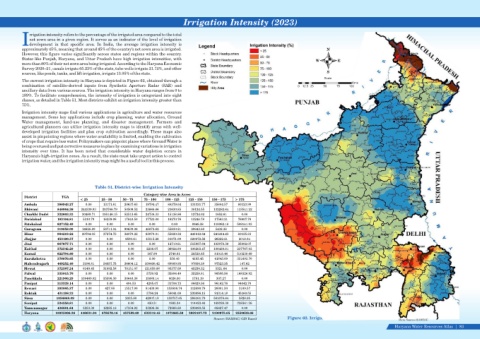
Irrigation Intensity (2023)


                rrigation intensity refers to the percentage of the irrigated area compared to the total
                net sown area in a given region. It serves as an indicator of the level of irrigation
            Idevelopment  in  that  specific  area.  In  India,  the  average  irrigation  intensity  is
            approximately 45%, meaning that around 45% of the country's net sown area is irrigated.                                                                N
            However, this figure varies significantly across states and regions within the country.
            States like Punjab, Haryana, and Uttar Pradesh have high irrigation intensities, with
                                                                                                                                                              W          E
            more than 80% of their net sown area being irrigated. According to the Haryana Economic
            Survey 2020–21, canals irrigate 65.23% of the state, tube wells irrigate 21.72%, and other
            sources, like ponds, tanks, and lift irrigation, irrigate 13.05% of the state.                                                                         S
                                                                                                                                                                  Scale
            The current irrigation intensity in Haryana is depicted in Figure 62, obtained through a
                                                                                                                                                                                Kms
            combination  of  satellite-derived  inputs  from  Synthetic  Aperture  Radar  (SAR)  and                                                 0  12.5 25   50    75    100
            ancillary data from various sources. The irrigation intensity in Haryana ranges from 0 to
            189%. To facilitate comprehension, the intensity of irrigation is categorized into eight
            classes, as detailed in Table 51. Most districts exhibit an irrigation intensity greater than
            75%.
            Irrigation intensity maps find various applications in agriculture and water resources
            management. Some key applications include crop planning, water allocation, Ground
            Water  management,  land-use  planning,  and  disaster  management.  Farmers  and
            agricultural planners can utilize irrigation intensity maps to identify areas with well-
            developed irrigation facilities and plan crop cultivation accordingly. These maps also
            assist in pinpointing regions where water availability is limited, enabling the cultivation
            of crops that require less water. Policymakers can pinpoint places where Ground Water is
            being overused and put corrective measures in place by examining variations in irrigation
            intensity  over  time.  It  has  been  noted  that  considerable  water  depletion  occurs  in
            Haryana's high-irrigation zones. As a result, the state must take urgent action to control
            irrigation water, and the irrigation intensity map might be a useful tool in this process.


                                                Table 51. District-wise Irrigation Intensity
                                                                        Category wise Area in Acres
             District           TGA
                                         < 25      25 - 50    50 - 75   75 - 100    100 - 125   125 - 150   150 - 175   > 175
             Ambala          388943.27     0.00     13171.81   20637.63   19794.47   88379.04   131031.77   35804.57   80123.99
             Bhiwani         848064.36   244339.93   203766.79   50509.52   23868.86   21630.85   38124.55   132282.64   133541.22
             Charkhi Dadri   332603.33    30489.71   195146.15   52513.65   24738.33   15138.86   12724.02   1852.61     0.00
             Faridabad       183104.81    5310.79   18239.98   17840.50   17723.00   16270.76   13248.78   17563.21    76907.78
             Fatehabad       627152.49     0.00       0.00      0.00       0.00       0.00      8948.38    110062.18   508141.93
             Gurugram        310858.09    14628.89   56711.04   99639.06   48872.62   55630.21   29943.88   5432.38      0.00
             Hisar           984219.22    29794.03   37274.73   34079.22   63979.01   55629.32   441912.64   241414.43   80135.83
             Jhajjar         453190.57     0.00       0.00     9590.61   13315.26   81071.09   320972.56   26222.21     2018.84
             Jind            667677.71     0.00       0.00      0.00       0.00     12719.61   515887.64   103978.39   35092.07
             Kaithal         572542.29     0.00       0.00      0.00      2216.07   36924.90   106203.47   189430.81   237767.03
             Karnal          622704.60     0.00       0.00      0.00      167.99     2740.61    28538.85   81018.46    510238.69
             Kurukshetra     378070.65     0.00       0.00      0.00       0.00      350.40     4183.45    41843.09    331693.70
             Mahendragarh    469252.40    3196.81   54857.75   36604.12   109406.42   69909.95   97606.38   97523.35    147.62
             Mewat           372387.24    6149.45   31092.58   70151.07   121059.08   93377.08   45236.32   5321.64      0.00
             Palwal          335815.70     0.00       0.00      0.00      5739.92   35894.49    35258.81   90595.56    168326.92
             Panchkula       221900.29   109469.02   55596.30   30640.38   15080.14   9026.00   1781.19     307.27       0.00
             Panipat         313329.14     0.00       0.00      494.53    4295.07   31704.73    86629.36   96162.76    94042.70
             Rewari          393885.37     0.00      427.88    15517.99   81430.90   153806.74   112690.78   26901.50   3109.57
             Rohtak          431198.23     0.00       0.00      0.00      5796.24   58041.09   230886.15   91314.18    45160.55
             Sirsa           1056868.09    0.00       0.00     2035.88   42007.18   159757.65   286161.79   561076.64   5828.95
             Sonipat         524356.81     0.00       0.00      0.00      430.51     1893.34   114433.40   169238.30   238361.26
             Yamunanagar     436881.64    5253.30   12285.16   17334.92   33298.36   72988.88   230093.55   65627.47     0.00
             Haryana        10925006.26   448631.94   678570.16   457589.09   633219.43   1072885.59   2892497.73   2190973.65   2550638.66
                                                                                                           Source: HARSAC/ GIS Based            Figure 62. Irrigation Intensity (2023)                 Data Source-HARSAC

                                                                                                                                                                                                     Haryana Water Resources Atlas     83|