
Page 94 - Haryana Water Resources Atlas 2025
P. 94
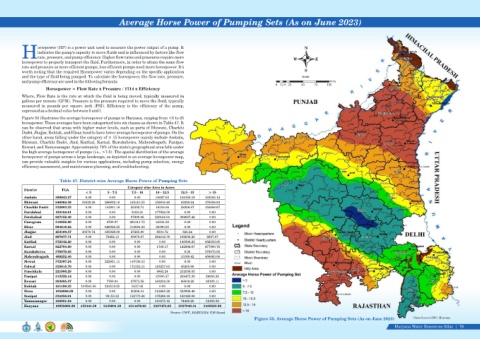
Average Horse Power of Pumping Sets (As on June 2023)


                    orsepower (HP) is a power unit used to measure the power output of a pump. It                                                       N
                    indicates the pump's capacity to move fluids and is influenced by factors like flow
            Hrate, pressure, and pump efficiency. Higher flow rates and pressures require more
                                                                                                                                                   W         E
            horsepower to properly transport the fluid. Furthermore, in order to attain the same flow
            rate and pressure as more efficient pumps, less efficient pumps need more horsepower. It's
            worth noting that the required Horsepower varies depending on the specific application                                                      S
            and the type of fluid being pumped. To calculate the horsepower, the flow rate, pressure,                                                  Scale
            and pump efficiency are used in the following formula:                                                                                                   Kms
                                                                                                                                          0  12.5 25   50    75    100
                        Horsepower = Flow Rate x Pressure / 1714 x Efficiency
            Where, Flow Rate is the rate at which the fluid is being moved, typically measured in
            gallons per minute (GPM). Pressure is the pressure required to move the fluid, typically
            measured  in  pounds  per  square  inch  (PSI).  Efficiency  is  the  efficiency  of  the  pump,
            expressed as a decimal value between 0 and 1.
            Figure 55 illustrates the average horsepower of pumps in Haryana, ranging from <5 to 25
            horsepower. These averages have been categorized into six classes as shown in Table 47. It
            can be observed that areas with higher water levels, such as parts of Bhiwani, Charkhi
            Dadri, Jhajjar, Rohtak, and Hisar, tend to have lower average horsepower of pumps. On the
            other hand, areas falling under the category of ≥ 15 horsepower mainly include Ambala,
            Bhiwani, Charkhi Dadri, Jind, Kaithal, Karnal, Kurukshetra, Mahendragarh, Panipat,
            Rewari, and Yamunanagar. Approximately 79% of the state's geographical area falls under
            the high average horsepower of pumps (i.e., >7.5). The spatial distribution of the average
            horsepower of pumps across a large landscape, as depicted in an average horsepower map,
            can provide valuable insights for various applications, including pump selection, energy
            efficiency assessment, and maintenance planning, and troubleshooting.


                                 Table 47. District-wise Average Horse Power of Pumping Sets
                                                                Category wise Area in Acres
             District           TGA
                                            < 5       5 - 7.5     7.5 - 10    10 - 12.5    12.5 - 15     > 15
             Ambala         388943.27      0.00        0.00         0.00      55627.93    150150.19    183165.14
             Bhiwani        848064.36     18329.28   266892.16   165410.55    156916.49    63928.94    176586.94
             Charkhi Dadri   332603.33     0.00      104901.18    25392.74    18316.08     28306.67    155686.67
             Faridabad      183104.81      0.00        0.00       5182.21     177922.59     0.00         0.00
             Fatehabad      627152.49      0.00        0.00       97899.06    220166.01   309087.42      0.00
             Gurugram       310858.09      0.00       4709.97    281313.73    24834.39      0.00         0.00
             Hisar          984219.22      0.00      646928.25   310894.28    26396.68      0.00         0.00
             Jhajjar        453190.57     30570.74   385026.08    27265.80     9501.72      826.24       0.00
             Jind           667677.71      0.00      78452.13     95978.67    294612.79   189036.25     9597.87
             Kaithal        572542.29      0.00        0.00         0.00        0.00      140509.23    432033.05
             Karnal         622704.60      0.00        0.00         0.00       1749.17    142994.67    477960.76
             Kurukshetra    378070.65      0.00        0.00         0.00        0.00        0.00       378070.65
             Mahendragarh   469252.40      0.00        0.00         0.00        0.00       13188.42    456063.98
             Mewat          372387.24      0.00      222651.11   149736.13      0.00        0.00         0.00
             Palwal         335815.70      0.00        0.00      171352.11    119257.63    45205.96      0.00
             Panchkula      221900.29      0.00        0.00         0.00       9862.24    212038.05      0.00
             Panipat        313329.14      0.00        0.00         0.00      27805.37    256473.39    29050.38
             Rewari         393885.37      0.00       7768.04     27873.56    183234.38    86819.28    88190.11
             Rohtak         431198.23    103541.36   324519.25    3137.62       0.00        0.00         0.00
             Sirsa          1056868.09     0.00        0.00       20266.34    512695.29   523906.46      0.00
             Sonipat        524356.81      0.00      93153.42    132775.24    178298.18   120129.98      0.00
             Yamunanagar    436881.64      0.00        0.00         0.00      310275.12    74448.20    52158.32
             Haryana        10925006.26   152441.38   2135001.59   1514478.03   2327472.05   2357049.34   2438563.88

                                                                                      Source: GWC, HARYANA/ GIS Based
                                                                                                                               Figure 55. Average Horse Power of Pumping Sets (As on June 2023)                Data Source-GWC, Haryana

                                                                                                                                                                                                     Haryana Water Resources Atlas     76|