
Page 95 - Haryana Water Resources Atlas 2025
P. 95
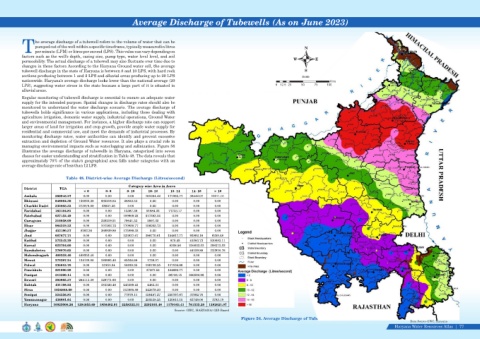
Average Discharge of Tubewells (As on June 2023)


                  he average discharge of a tubewell refers to the volume of water that can be
                  pumped out of the well within a specific timeframe, typically measured in litres                                                      N
            Tper minute (LPM) or litres per second (LPS). This value can vary depending on
            factors such as the well's depth, casing size, pump type, water level level, and soil
                                                                                                                                                   W         E
            permeability. The actual discharge of a tubewell may also fluctuate over time due to
            changes in these factors According to the Haryana Ground water cell, the average
            tubewell discharge in the state of Haryana is between 8 and 10 LPS, with hard rock                                                          S
            sections producing between 1 and 2 LPS and alluvial areas producing up to 20 LPS                                                           Scale
            nationwide. Haryana's average discharge looks lower than the national average (20                                                                        Kms
            LPS), suggesting water stress in the state because a large part of it is situated in                                          0  12.5 25   50    75    100
            alluvial areas.
            Regular monitoring of tubewell discharge is essential to ensure an adequate water
            supply for the intended purpose. Spatial changes in discharge rates should also be
            monitored to understand the water discharge scenario. The average discharge of
            tubewells  holds  significance  in  various  applications,  including  those  dealing  with
            agriculture irrigation, domestic water supply, industrial operations, Ground Water
            and environmental management. For instance, a higher discharge rate can support
            larger areas of land for irrigation and crop growth, provide ample water supply for
            residential and commercial use, and meet the demands of industrial processes. By
            monitoring  discharge  rates,  water  authorities  can  identify  and  prevent  excessive
            extraction and depletion of Ground Water resources. It also plays a crucial role in
            managing environmental impacts such as waterlogging and salinization. Figure 56
            illustrates the average discharge of tubewells in Haryana, categorized into seven
            classes for easier understanding and stratification in Table 48. The data reveals that
            approximately 70% of the state's geographical area falls under categories with an
            average discharge rate of less than 12 LPS.


                                  Table 48. District-wise Average Discharge (Litres/second)
                                                                 Category wise Area in Acres
             District         TGA
                                          < 6        6- 8       8- 10      10- 12     12- 14    14- 16     > 16
             Ambala         388943.27     0.00       0.00       0.00     161004.42   177285.77   38442.07   12211.01
             Bhiwani        848064.36   156022.38   665218.64   26823.33   0.00       0.00       0.00       0.00
             Charkhi Dadri   332603.33   273076.08   59527.25   0.00       0.00       0.00       0.00       0.00
             Faridabad      183104.81     0.00       0.00      13387.38   91984.25   77733.17    0.00       0.00
             Fatehabad      627152.49     0.00       0.00     109869.25   517283.24   0.00       0.00       0.00
             Gurugram       310858.09     0.00     228219.51   79641.33   2997.25     0.00       0.00       0.00
             Hisar          984219.22     0.00     107262.72   770950.77   106005.73   0.00      0.00       0.00
             Jhajjar        453190.57    8262.36   268939.89   175988.32   0.00       0.00       0.00       0.00
             Jind           667677.71     0.00       0.00     123937.67   288770.61   154817.77   93892.18   6259.48
             Kaithal        572542.29     0.00       0.00       0.00       0.00       875.45   41583.73   530083.11
             Karnal         622704.60     0.00       0.00       0.00       0.00      8308.56   216022.52   398373.52
             Kurukshetra    378070.65     0.00       0.00       0.00       0.00       0.00     44159.89   333910.76
             Mahendragarh   469252.40   469252.40    0.00       0.00       0.00       0.00       0.00       0.00
             Mewat          372387.24   124129.08   180985.40   65536.68   1736.07    0.00       0.00       0.00
             Palwal         335815.70     0.00      33151.04   56830.35   128729.35   117104.96   0.00      0.00
             Panchkula      221900.29     0.00       0.00       0.00      37207.52   184692.77   0.00       0.00
             Panipat        313329.14     0.00       0.00       0.00       0.00      86736.15   226592.99   0.00
             Rewari         393885.37   264113.39   129771.98   0.00       0.00       0.00       0.00       0.00
             Rohtak         431198.23     0.00     183326.48   243389.43   4482.31    0.00       0.00       0.00
             Sirsa          1056868.09    0.00       0.00     513988.89   542879.20   0.00       0.00       0.00
             Sonipat        524356.81     0.00       0.00      77979.11   158487.27   250797.67   37092.76   0.00
             Yamunanagar    436881.64     0.00       0.00       0.00     250538.25   120811.15   63749.06   1783.19
             Haryana       10925006.26   1294855.69   1856402.91   2258322.51   2292105.48   1179163.41   761535.20   1282621.07
                                                                                        Source: GWC, HARYANA/ GIS Based
                                                                                                                         Figure 56. Average Discharge of Tubewells (As on June 2023)
                                                                                                                                                                                                             Data Source-GWC, Haryana
                                                                                                                                                                                                     Haryana Water Resources Atlas     77|