
Page 93 - Haryana Water Resources Atlas 2025
P. 93
Position of Pumps (As on June 2023)
he position of pumps refers to their location in relation to the water source or
well and the surface level. It is determined by various factors including the water N
Tsource's location, distance and elevation to the distribution network, pump type,
irrigation requirements, and urban infrastructure. Water resource managers,
W E
emergency response teams, maintenance workers, and other stakeholders involved in
water supply system management might benefit greatly from having maps showing the
locations of pumps. These maps offer perceptions and data that may be applied to S
evaluate how local ecosystems are affected by pumps in terms of the environment. By Scale
analyzing pump positions, areas with limited water availability can be identified. The Kms
pump position map aids in planning and managing agricultural irrigation systems, 0 12.5 25 50 75 100
helping farmers optimize water usage and crop production. In rural parts of India, hand
pumps are commonly used for accessing Ground Water at shallow depths of 10-30
meters below ground level (mbgl). In urban areas, submersible pumps in deeper
borewells, ranging from 50-300 mbgl, or canal water supply systems are employed.
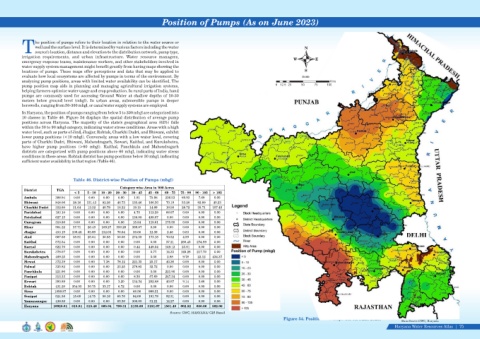
In Haryana, the position of pumps ranging from below 5 to 200 mbgl are categorized into
10 classes in Table 46. Figure 54 displays the spatial distribution of average pump
positions across Haryana. The majority of the state's geographical area (62%) falls
within the 30 to 90 mbgl category, indicating water stress conditions. Areas with a high
water level, such as parts of Jind, Jhajjar, Rohtak, Charkhi Dadri, and Bhiwani, exhibit
lower pump positions (<10 mbgl). Conversely, areas with a low water level, covering
parts of Charkhi Dadri, Bhiwani, Mahendragarh, Rewari, Kaithal, and Kurukshetra,
have higher pump positions (>60 mbgl). Kaithal, Panchkula and Mahendragarh
districts are categorized with pump positions above 60 mbgl, indicating water stress
conditions in these areas. Rohtak district has pump positions below 30 mbgl, indicating
sufficient water availability in that region (Table 46).
Table 46. District-wise Position of Pumps (mbgl)
Category wise Area in '000 Acres
District TGA
< 5 5 - 10 10 - 20 20 - 30 30 - 45 45 - 60 60 - 75 75 - 90 90 - 105 > 105
Ambala 388.94 0.00 0.00 0.00 0.00 1.81 75.98 236.53 66.93 7.69 0.00
Bhiwani 848.06 28.16 131.43 82.26 48.73 135.46 166.30 70.19 53.20 92.09 40.23
Charkhi Dadri 332.60 31.64 13.32 40.79 18.32 19.15 14.99 19.56 28.72 38.71 107.40
Faridabad 183.10 0.00 0.00 0.00 0.00 4.75 112.28 66.07 0.00 0.00 0.00
Fatehabad 627.15 0.00 0.00 0.00 0.00 138.08 489.07 0.00 0.00 0.00 0.00
Gurugram 310.86 0.00 0.00 0.00 0.86 15.84 118.61 175.55 0.00 0.00 0.00
Hisar 984.22 37.71 28.49 169.27 350.28 389.67 8.80 0.00 0.00 0.00 0.00
Jhajjar 453.19 109.48 65.69 152.03 70.64 39.66 12.39 2.48 0.83 0.00 0.00
Jind 667.68 38.81 25.04 30.88 50.08 274.58 173.18 70.52 4.59 0.00 0.00
Kaithal 572.54 0.00 0.00 0.00 0.00 0.00 0.00 37.21 260.45 274.89 0.00
Karnal 622.70 0.00 0.00 0.00 0.00 0.44 449.54 149.12 23.61 0.00 0.00
Kurukshetra 378.07 0.00 0.00 0.00 0.00 0.00 0.77 14.33 145.26 217.70 0.00
Mahendragarh 469.25 0.00 0.00 0.00 0.00 0.00 0.00 2.98 9.78 22.12 434.37
Mewat 372.39 0.00 0.00 7.38 78.12 221.35 25.17 40.36 0.00 0.00 0.00
Palwal 335.82 0.00 0.00 0.00 23.25 279.85 32.72 0.00 0.00 0.00 0.00
Panchkula 221.90 0.00 0.00 0.00 0.00 0.00 0.00 221.90 0.00 0.00 0.00
Panipat 313.33 0.00 0.00 0.00 0.00 8.30 57.69 247.34 0.00 0.00 0.00
Rewari 393.89 0.00 0.00 0.00 3.20 134.34 202.88 40.67 9.14 3.66 0.00
Rohtak 431.20 354.55 36.75 33.17 6.72 0.00 0.00 0.00 0.00 0.00 0.00
Sirsa 1056.87 0.00 0.00 0.00 0.00 68.56 988.31 0.00 0.00 0.00 0.00
Sonipat 524.36 15.60 14.75 50.16 65.76 94.00 191.79 92.31 0.00 0.00 0.00
Yamunanagar 436.88 0.00 0.00 0.00 83.36 308.05 31.21 14.27 0.00 0.00 0.00
Haryana 10925.01 615.94 315.48 565.94 799.31 2133.88 3151.67 1501.40 602.52 656.86 582.00
Source: GWC, HARYANA/ GIS Based
Figure 54. Position of Pumps (As on June 2023)
Data Source-GWC, Haryana
Haryana Water Resources Atlas 75|